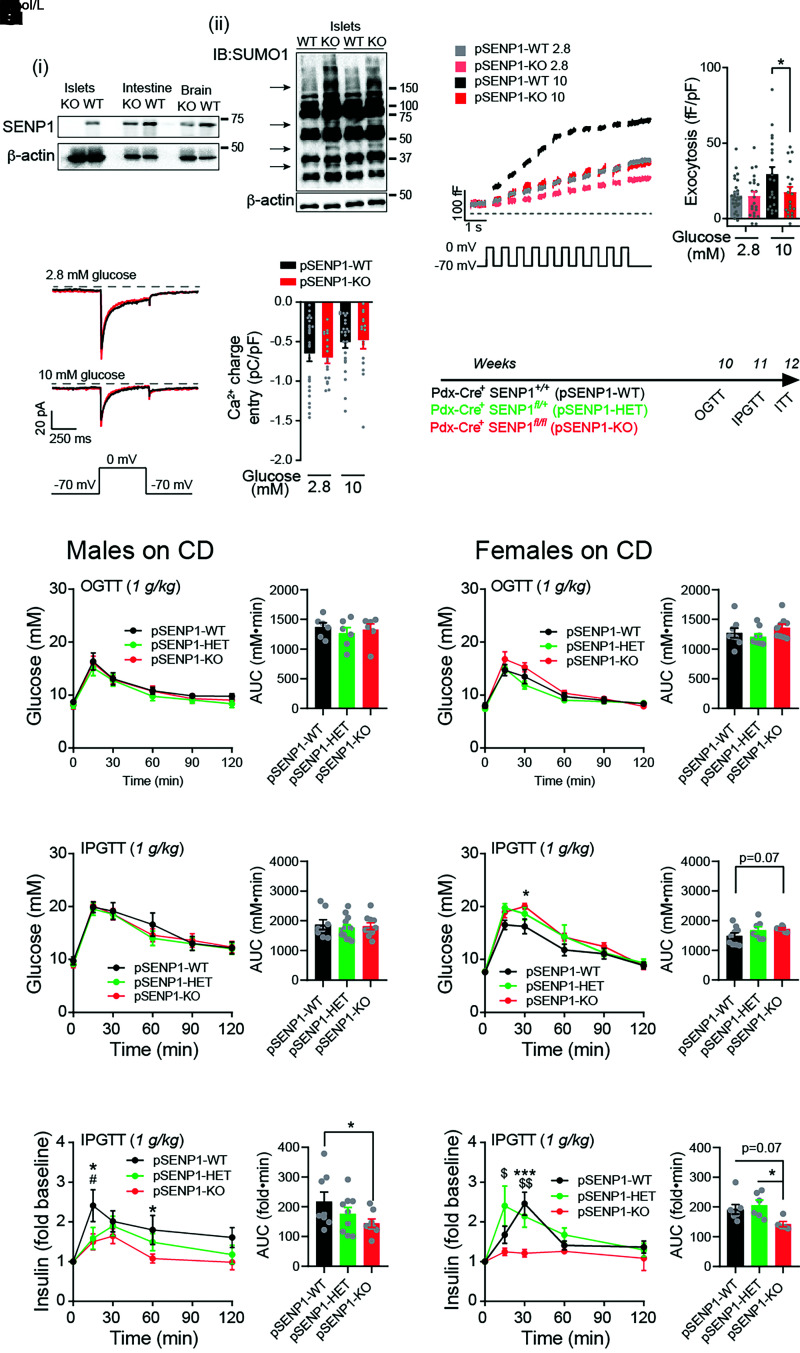
Figure 1.
Normal glucose tolerance, but impaired insulin responses, of pSENP1-KO mice on CD. A: i) Western blot of SENP1 expression in tissues from pSENP1-WT and -KO mice. ii) SUMOylation profiles of islet lysates from pSENP1-WT and -KO mice showing numerous SUMOylated proteins. B: Representative traces (left) and average total responses of β-cell exocytosis elicited by a series of 500-ms membrane depolarizations from −70 to 0 mV at 2.8 and 10 mmol/L glucose (n = 28, 22, 22, and 20 cells; n values correspond to graph bars from left to right, respectively). The pipette solution included 0.1 mmol/L cAMP. C: Representative traces, and average β-cell voltage-dependent Ca2+ currents elicited by a single 500-ms membrane depolarization from −70 to 0 mV at 2.8 and 10 mmol/L glucose (n = 26, 18, 25, and 16 cells). The pipette solution included 0.1 mmol/L cAMP. D: Schematic diagram of experiments on CD-fed mice. E: OGTT in male pSENP1-WT, -HET, and -KO mice (n = 6, 6, and 6 mice). F and G: IPGTT in male pSENP1-WT, -HET, and -KO mice (n = 8, 13, and 10 mice) (F) and associated plasma insulin responses (n = 8, 9, and 8 mice) (G). H: OGTT in female pSENP1-WT, -HET, and -KO mice (n = 8, 9, and 9 mice). I and J: IPGTT in female pSENP1-WT, -HET, and -KO mice (n = 9, 7, and 7 mice) (I) and associated plasma insulin responses (n = 8, 6, and 5 mice) (J). Data are mean ± SEM and were compared using one-way or two-way ANOVA followed by Bonferroni posttest. *P < 0.05, ***P < 0.001 between pSENP1-WT and -KO; #P < 0.05 between pSENP1-HET and pSENP1-WT; $P < 0.05, $$P < 0.01 between pSENP1-HET and pSENP1-KO, unless otherwise indicated. AUC, area under the curve; IB, immunoblotting.

