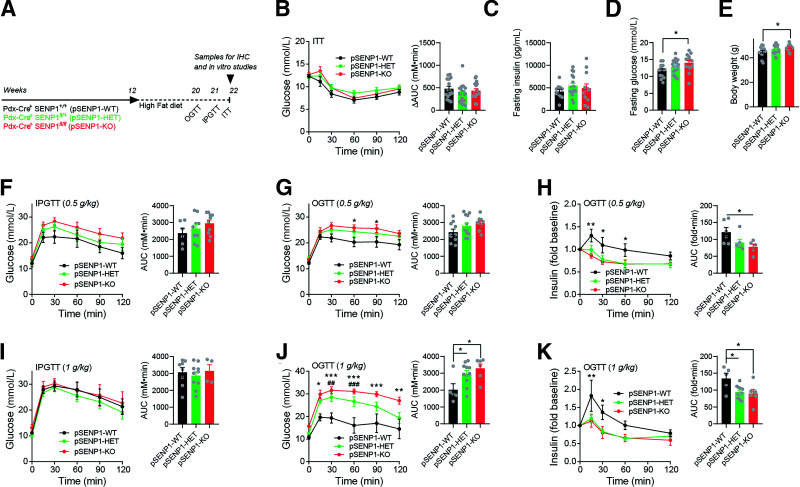
Figure 2.
Selective worsening of oral glucose tolerance in pSENP1-KO mice after high-fat feeding. A: Schematic diagram of experiments on HFD. B–E: ITT, fasting insulin, fasting glucose, and body weight of male pSENP1-WT, -HET, and -KO mice on HFD (n = 15, 22, and 17 mice [B]; n = 10, 17, and 12 mice [C]; n = 13, 21, and 14 mice [D]; n = 14, 23, and 14 mice [E]). F: IPGTT with 0.5 g/kg dextrose in male pSENP1-WT, -HET, and -KO mice after HFD (n = 6, 9, and 10 mice). G and H: OGTT (0.5 g/kg dextrose) of male pSENP1-WT, -HET, and -KO mice after HFD (n = 10, 12, and 9 mice) (G) and associated plasma insulin responses (n = 6, 6, and 5 mice) (H). I: IPGTT with 1 g/kg dextrose in male pSENP1-WT, -HET, and -KO mice after HFD (n = 8, 10, and 4 mice). J and K: OGTT (1 g/kg dextrose) of male pSENP1-WT, -HET, and -KO mice after HFD (n = 5, 11, and 6 mice) (J) and associated plasma insulin responses (n = 5, 11, and 6 mice) (K). Data are mean ± SEM and were compared using Student t test or one-way or two-way ANOVA followed by Bonferroni posttest. *P < 0.05, **P < 0.01, ***P < 0.001 between pSENP1-WT and pSENP1-KO; ##P < 0.01, ###P < 0.001 between pSENP1-HET and pSENP1-WT. AUC, area under the curve; IHC, immunohistochemistry.

