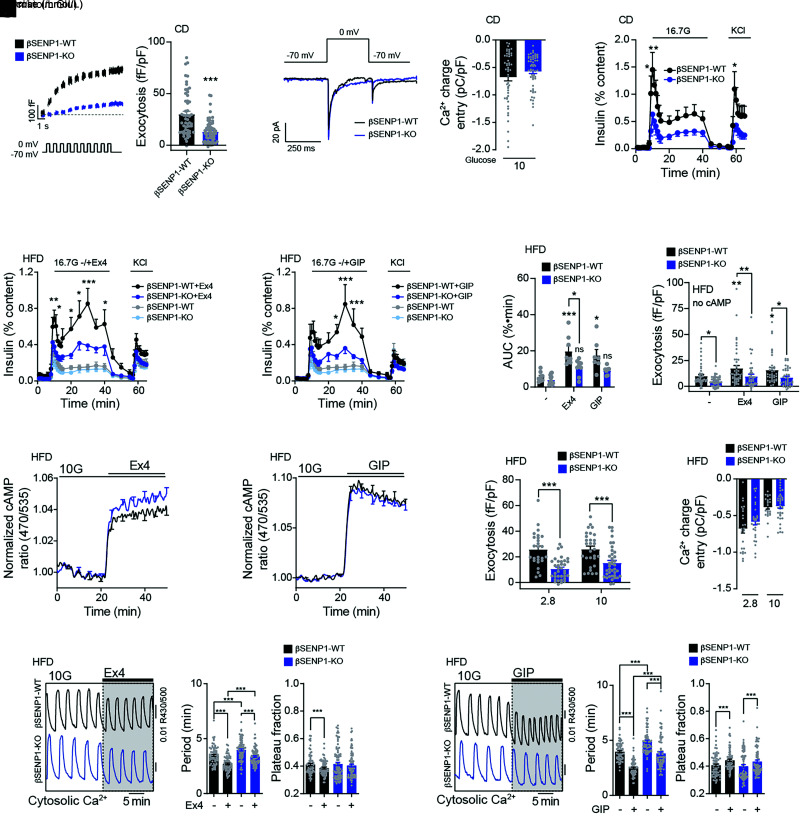
Figure 6.
Impaired insulin secretion and exocytosis to glucose and incretins from βSENP1-KO islets following HFD. A: Representative traces (left) and averaged exocytosis elicited by a series of 500-ms membrane depolarizations from −70 to 0 mV in β-cells from male βSENP1-WT and -KO mice on CD at 10 mmol/L glucose (n = 55 and 61 cells from 5 and 7 mice). The pipette solution included 0.1 mmol/L cAMP. B: Representative Ca2+ current traces and average integrated Ca2+ entry of β-cell elicited by a single 500-ms membrane depolarization from −70 to 0 mV at 10 mmol/L glucose (n = 51 and 57 cells). The pipette solution included 0.1 mmol/L cAMP. C: Insulin secretion from male βSENP1-WT and -KO islets from mice on CD in response to glucose (n = 8 and 7). D and F: Side-by-side insulin secretion from βSENP1-WT and -KO islets from male mice following HFD in response to glucose alone (n = 9 and 12) (D and F) or together with Ex4 (10 nmol/L) (n = 8 and 9) (D) or GIP (100 nmol/L) (n = 7 and 7) (E) and respective area under the curve (AUC) during the glucose stimulation (F). G: Exocytosis in β-cells of male βSENP1-WT and -KO mice, following HFD, elicited by a series of 500-ms membrane depolarization from −70 to 0 mV at 5 mmol/L glucose alone or with Ex4 (10 nmol/L) or GIP (100 nmol/L) (n = 44, 46, 47, 38, 40, and 41 cells from 5 mice per group). cAMP 0.1 mmol/L was omitted from pipette solution. H and I: The cAMP response at 10 mmol/L glucose to Ex4 (10 nmol/L) (n = 4 pairs of mice, 68 and 74 islets) (H) or GIP (100 nmol/L) (n = 4 pairs of mice, 73 and 88 islets) (I). J: Exocytosis in β-cells of male βSENP1-WT and -KO mice following HFD at 2.8 and 10 mmol/L glucose, with 0.1 mmol/L cAMP included in the pipette solution (n = 26, 35, 29, and 38 cells from 3, 4, 3, and 4 mice). K: Average integrated Ca2+ charge entry during voltage-dependent Ca2+ currents elicited from β-cells by a single 500-ms membrane depolarization from −70 to 0 mV at 2.8 and 10 mmol/L glucose (n = 26, 30, 30, and 38 cells from 3, 4, 3, and 4 mice). The pipette solution included 0.1 mmol/L cAMP. L and M: Representative Ca2+ responses (left), oscillation period, and Ca2+ plateau fraction at 10 mmol/L glucose to Ex4 (n = 4 pairs of mice, 73 and 88 cells) (L) and to GIP (n = 4 pairs of mice, 68 and 74 cells) (M). Data are mean ± SEM and were compared using Student t test or one-way or two-way ANOVA followed by Bonferroni posttest. *P < 0.05, **P < 0.01, ***P < 0.001 between βSENP1-WT and -KO under the same condition.

