
Figure 1.
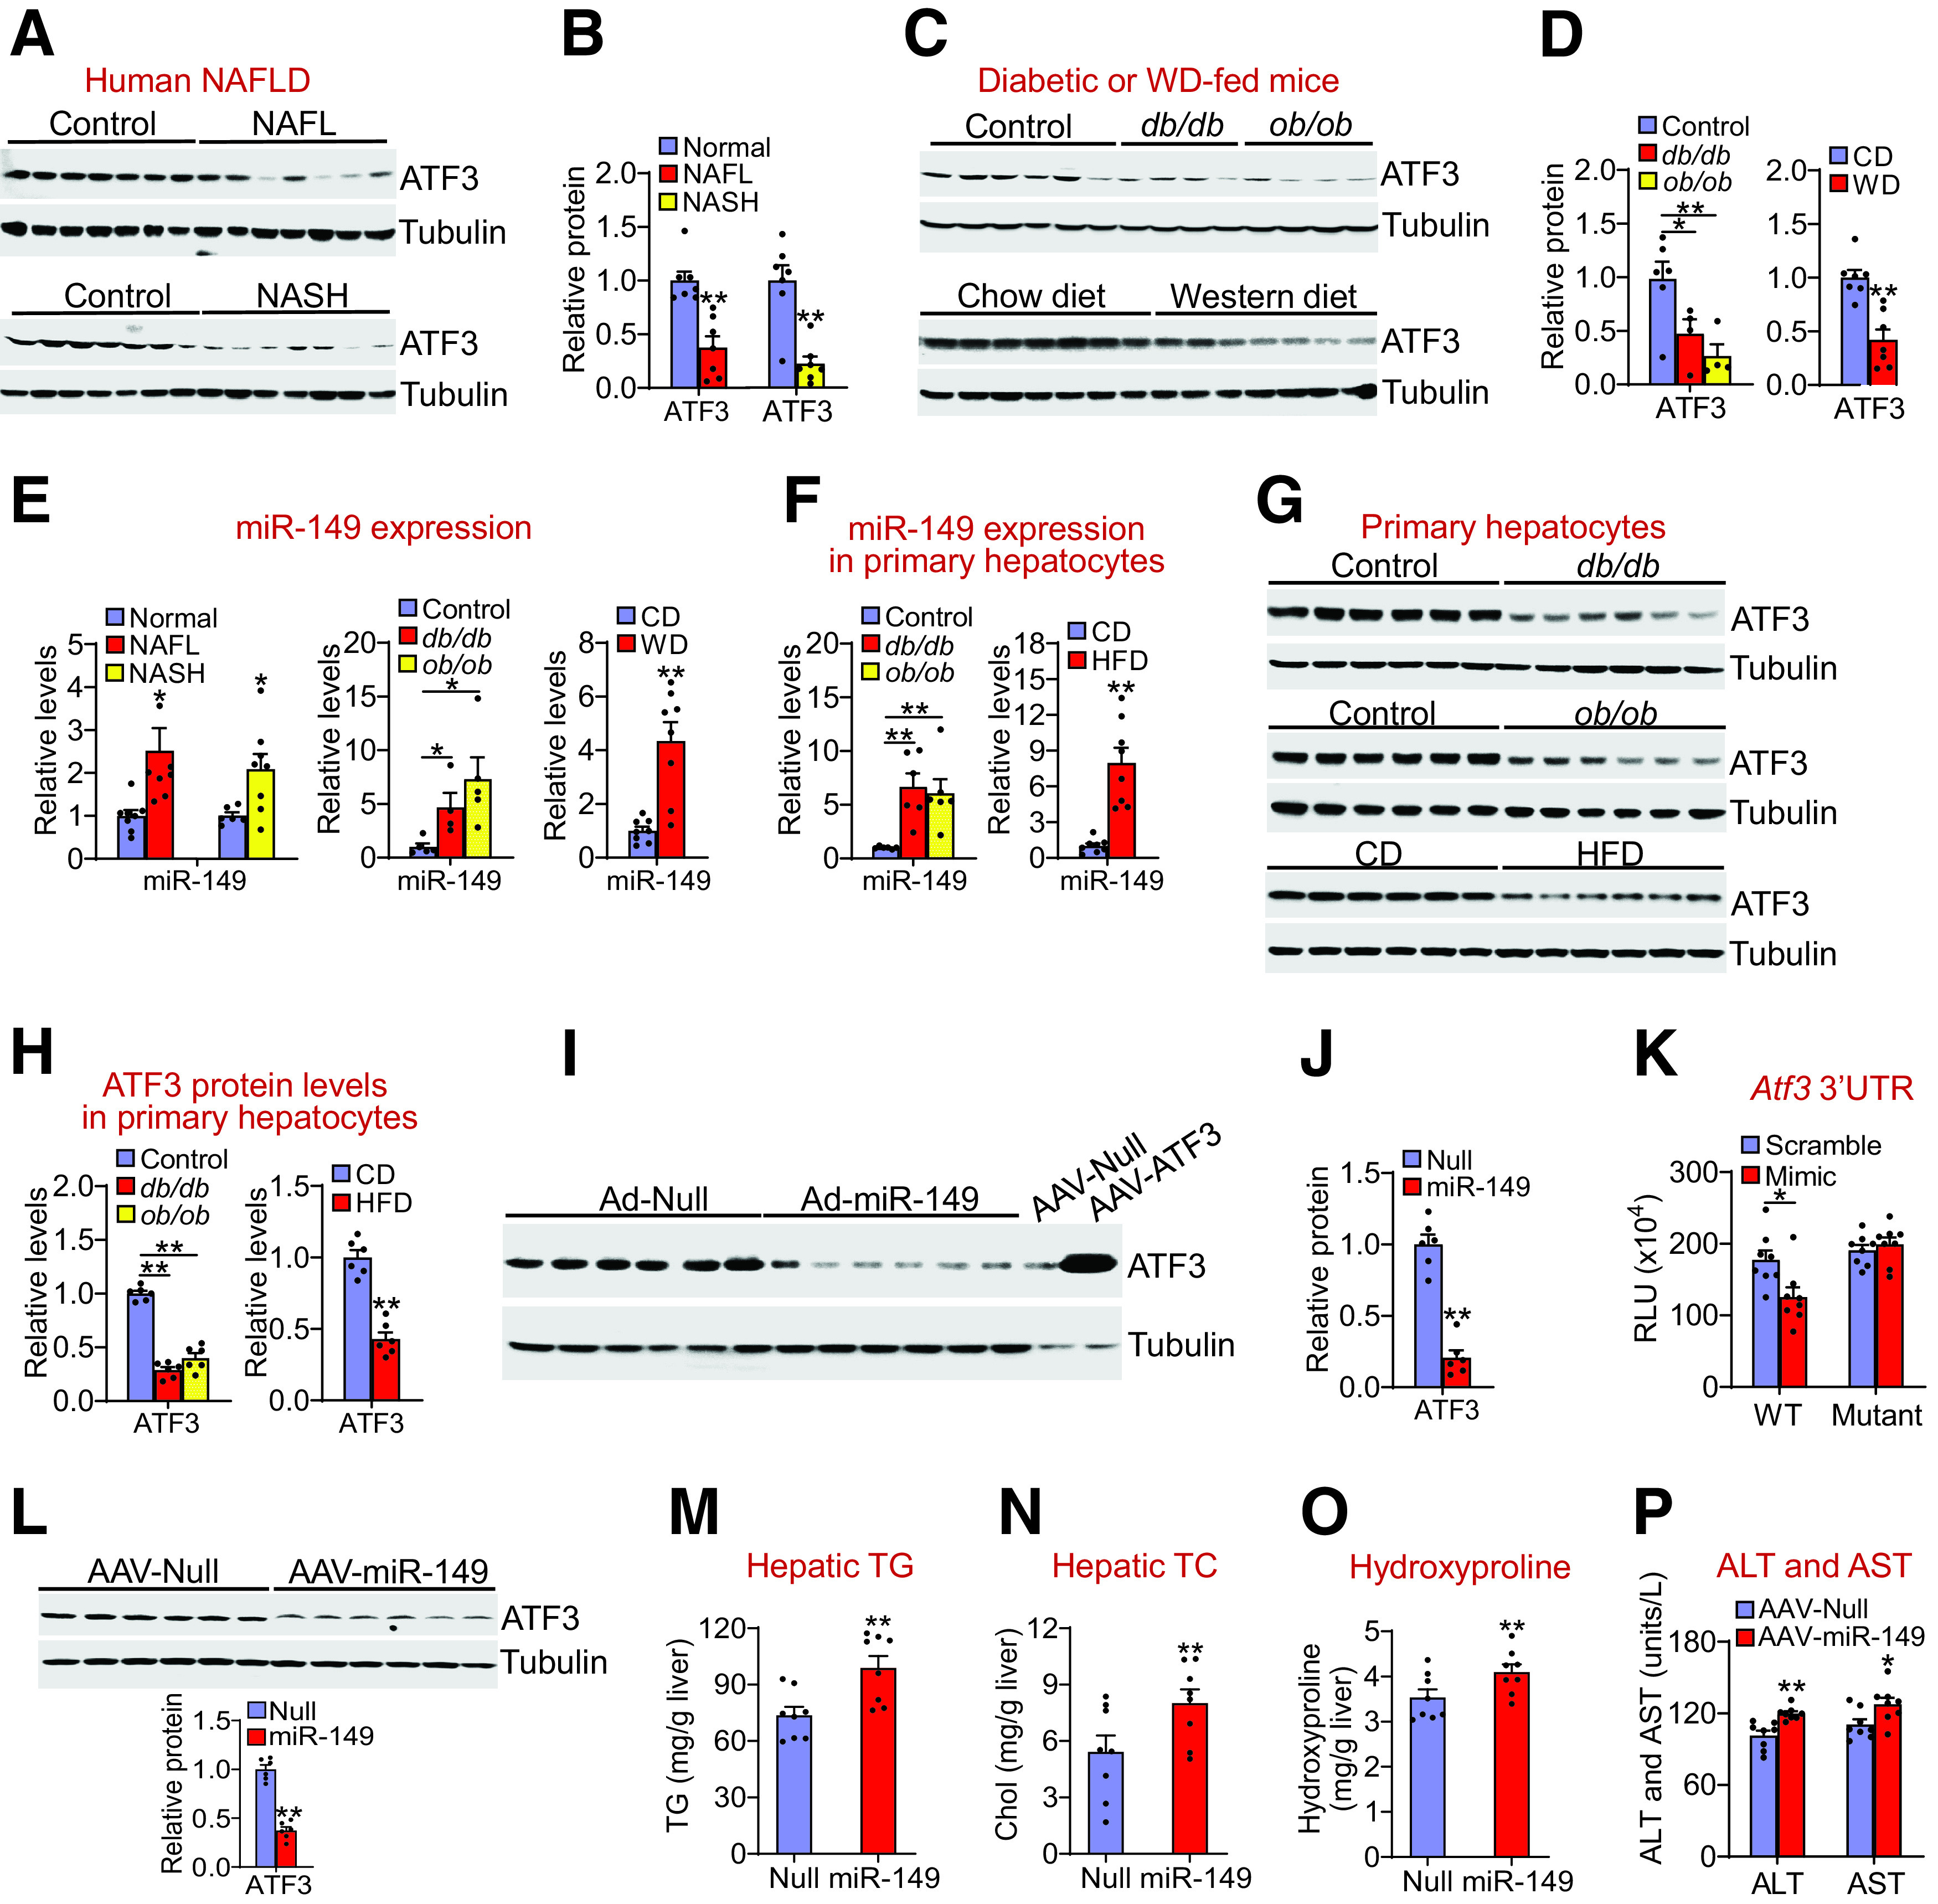
Hepatic ATF3 expression is reduced in NAFLD and is inhibited by miR-149. Hepatic proteins in normal individuals (control), NAFL patients (top panel), or NASH patients (bottom panel) were determined by Western blot assays (A), and ATF3 protein levels were quantified (B) (n = 7 per group). Hepatic proteins in the control, db/db, or ob/ob mice (top panel; n = 4–6 per group), or in the C57BL/6J mice fed a chow diet (CD) or WD (bottom panel; n = 7 per group) were determined by Western blot assays (C), and ATF3 protein levels were quantified (D). E: Hepatic miR-149 levels in NAFL or NASH patients (left panel; n = 6–8 per group), db/db or ob/ob mice (middle panel; n = 4–5 per group), or WD-fed mice (right panel; n = 8 per group) were determined. F–H: Primary hepatocytes were isolated from control mice, db/db mice, or ob/ob mice (n = 6 per group), or mice fed a chow diet (CD) or HFD for 2 months (n = 8 per group). MiR-149 levels were quantified (F), and protein levels were determined by Western blot assays (G and H). I and J: C57BL/6 mice were i.v. injected with Ad-Empty or Ad-miR-149. After 7 days, Western blot assays were performed (I), and hepatic ATF3 protein levels were quantified (J) (n = 6 per group). Hepatic protein lysates from mice infected with AAV8-ALB-Null or AAV8-ALB-ATF3 were used for a positive control (I). K: Wild-type or mutant Atf3 3′UTR luciferase plasmids were cotransfected with miR-149 mimics or scramble controls. After 36 h, luciferase activity was determined (n = 8 per group). RLU, relative luciferase units. L–P: C57BL/6J mice were i.v. injected with AAV8-ALB-Null or AAV8-ALB-miR-149 and then fed the HFCF diet for 16 weeks (n = 8 per group). L: Hepatic protein levels were determined by Western blot assays (top and bottom panels). Hepatic levels of TG (M), TC (N), and hydroxyproline (O) as well as plasma ATL and AST levels (P) were determined. All values are expressed as mean ± SEM. *P < 0.05, **P < 0.01 vs. control.