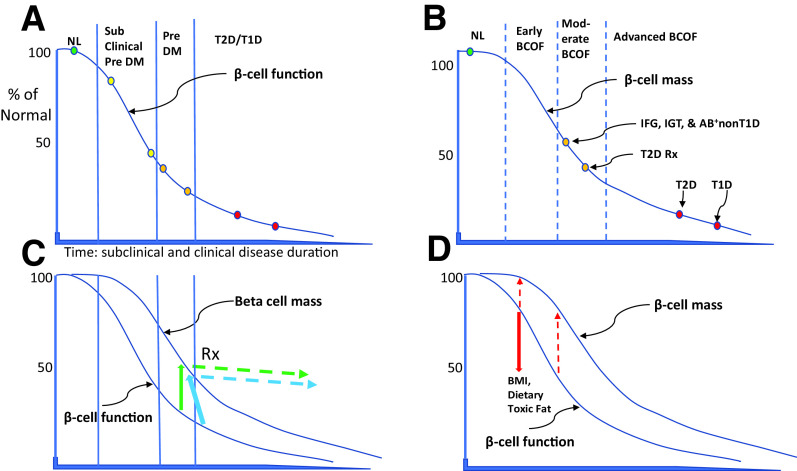
Figure 1.
Natural history of BCOD and BCOF depicted as percentage of normal on y-axis. The x-axis depicts duration for T1D (years) and T2D (decades). Two sigmoid curves approximate referenced, data-specific BCOD (A) and β-cell mass (B). A: Solid vertical lines depict currently defined normal (NL, green circle), subclinical prediabetes (subclinical Pre DM, yellow circles), prediabetes (Pre DM, orange circles), and T2D and T1D (red circles). B: Dashed vertical lines define normal (NL, green circle), early BCOF (no data available), moderate BCOF (orange circles), and advanced BCOF (red circles). C: Green solid arrow depicts ∼75% BCOD but only ∼50% BCOF content loss. BCOD can be rescued from the natural history or inadequate treatment with preserved β-cell content in some individuals (green dashed arrow, Rx [treatment]). Even some T2D cases can be rescued, with treatment returning them to prediabetes (blue arrows). D: Red solid arrow depicts impairment of BCOD, e.g., by environmental factors, from ∼25% to ∼50%, with less impairment of β-cell mass from ∼5% to ∼20% (red dashed arrows).

