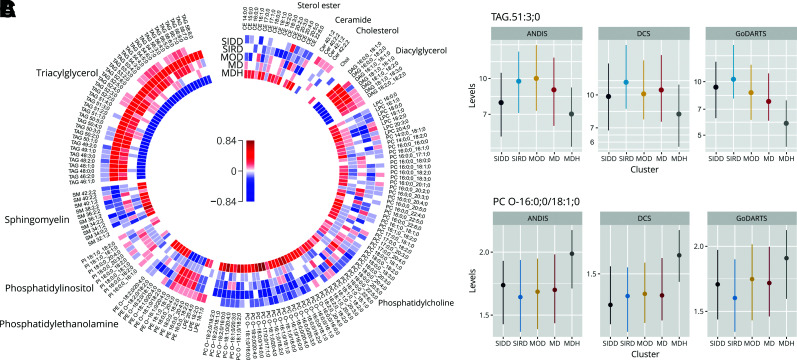
Figure 2.
Lipid levels in the five clusters. A: Change in lipid levels in each of the clusters versus all others. Colors represent effect size in log SD: red, upregulation, and blue, downregulation. B: Levels of TAG 51:3;0 in DCS, GoDARTS, and ANDIS. SIRD, MOD, and MDH PFDR ≤ 0.05. C: Levels of PC O-16:0;0/18:1;0. SIRD, MOD, and MDH PFDR ≤ 0.05. Dots represent the median, and the vertical line represents the interquartile range.

