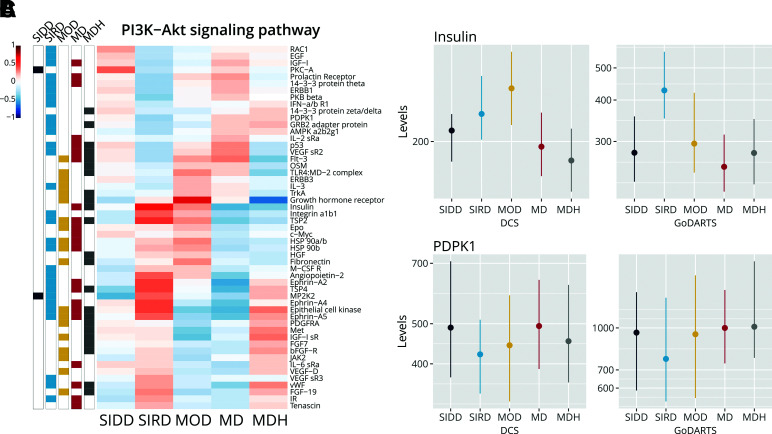
Figure 3.
Proteins in the PI3K/Akt pathway in the five clusters. A: Effect sizes of proteins in the PI3K/Akt pathway (PFDR = 1.05 · 10−29) with upregulation (red) in the cluster vs. all others and downregulation (blue). Bars on the left indicate whether proteins are statistically significant in a specific cluster. Dots represent the median, and the vertical line represents the interquartile range. B: Levels of insulin in DCS, GoDARTS, and ANDIS. MDH PFDR ≤ 0.05. C: Levels of PDPK1. Dots represent the median, and the vertical line represents the interquartile range. SIRD PFDR ≤ 0.05.

