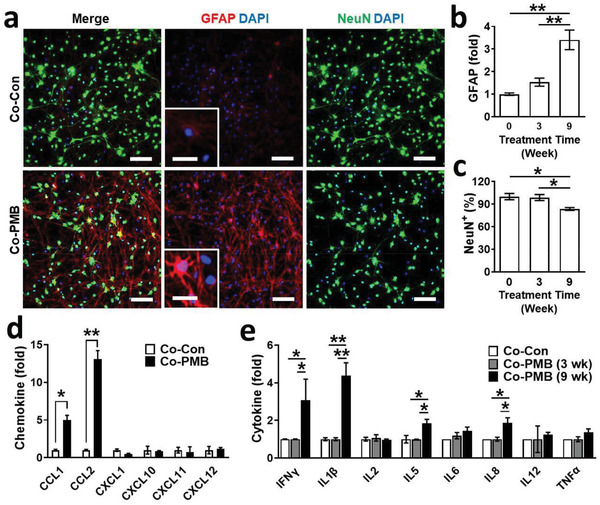
Figure 2.

Induction of reactive astrocytes by PM2.5. a) Immunostaining results of Co‐Con and Co‐PMB for neurons (NeuN, green) and astrocytes (GFAP, red). Scale bars represent 50 µm. Zoomed‐in images focus on astrocyte‐positive cells. Scale bars represent 15 µm. b) Increased astrocyte reactivity was assessed by fluorescent intensity of GFAP as a function of PM2.5 treatment time in Co‐PMB (n = 7). Data represent means ± SD. **, p < 0.01; measured by one‐way ANOVA with Bonferroni post‐hoc correction for multiple comparisons. c) Decrease of neuronal population was measured by counting NeuN‐positive cells (n = 7). Data represent means ± SD. *, p < 0.05; measured by one‐way ANOVA with Bonferroni post‐hoc correction for multiple comparisons. d) Production of chemokines by Co‐Con or Co‐PMB (n = 4). Data represent means ± SD. *, p < 0.05; **, p < 0.01; measured by one‐way ANOVA with Tukey post‐hoc correction for multiple comparisons. e) Production of cytokines by Co‐Con or Co‐PMB (n = 4). Data represent means ± SD. *, p < 0.05; **, p < 0.01; measured by one‐way ANOVA with Tukey post‐hoc correction for multiple comparisons.
