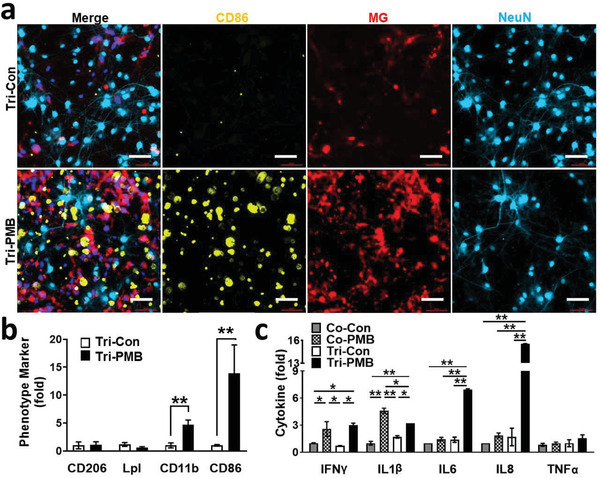
Figure 5.

M1 polarization in Tri‐PMB model. a) Tri‐PMB model was immunostained with M1 marker (CD86, yellow) and Neu marker (NeuN, sky blue). Microglia were fluorescently labeled (red). Scale bars represent 50 µm. b) Quantitative results were represented as bar graphs (n = 7). Other phenotype markers, such as CD206, Lpl, and CD11b were also quantified after immunostaining and represented in (b) (n = 7). Data represent means ± SD. **, p < 0.01; measured by one‐way ANOVA with Bonferroni post‐hoc correction for multiple comparisons. c) Assessment of proinflammatory cytokines (n = 4). Data represent means ± SD. *, p < 0.05; **, p < 0.01; measured by one‐way ANOVA with Bonferroni post‐hoc correction for multiple comparisons.
