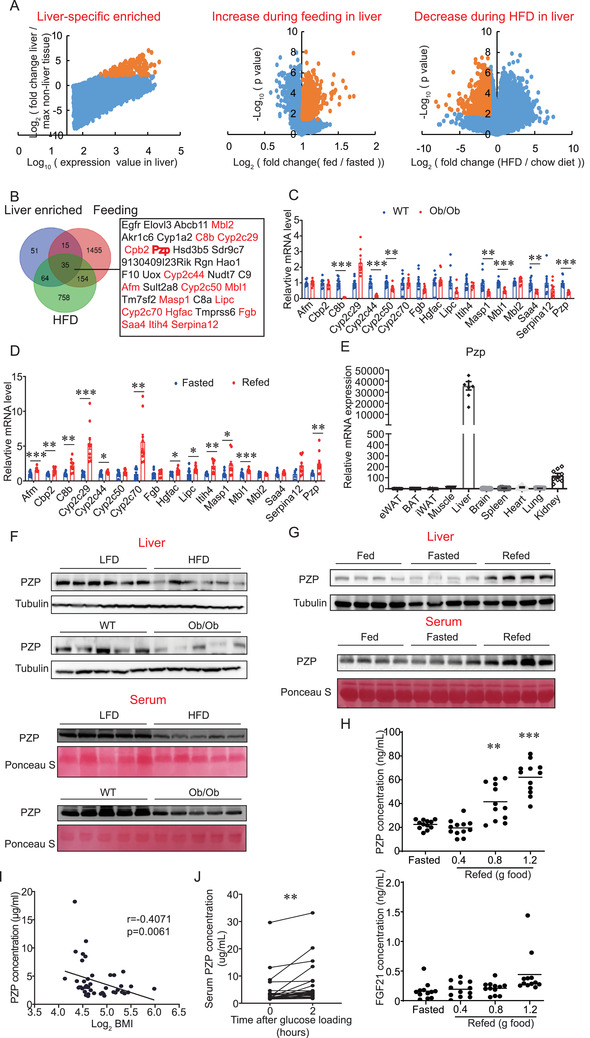
Figure 1.

Identification of PZP as a hepatokine which is upregulated during refeeding. A) Scatter diagram of transcriptomic data‐mining strategy showing the three cohort of genes. Yellow dots indicate a cluster of genes which meet our determinative criteria. B) Venn diagram showing the overlap of three screened list. Gene name in red letter indicates a secreted protein. C) Relative mRNA expression of candidates in liver from WT or Ob/Ob mice (n = 7–10). 7 of total 17 detected genes were decreased in Ob/Ob mice compared with WT mice. D) Relative mRNA expression of candidates in liver from Fasted (24 h) or refed (6 h) mice (n = 9–10). 10 of total 17 detected genes were increased under refed condition. E) qPCR analysis of PZP expression in mouse tissues (n = 6–8). PZP was specific high expressed in liver than other tissue. F) Western blot analysis of PZP protein level in liver and serum from HFD mice or Ob/Ob mice which showed PZP protein levels were significantly down‐regulated in obese mice. G) Western blot analysis of PZP protein level in liver and serum after feeding or fasting (24 h) or refeeding (6 h) are shown. H) Serum concentration of PZP and FGF21 in mice after fasting (24 h) or different refeeding food intake (0.4, 0.8, 1.2 gram) which showed PZP expression were regulated by food intake in a dose‐dependent manner. I) Spearman correlation between circulating PZP concentration and log2 BMI which showed circulating PZP level inversely correlated with log2 (BMI). χ 2 tests were used for statistical analysis (n = 44). J) Serum concentration of PZP was significantly increased in human participants during OGTT. Paired sample T‐test was used for statistical analysis (n = 24). Data are shown as mean ± SEM. Two‐tailed Student's t‐test (C,D) or one‐way ANOVA (H) with multiple comparisons and Tukey's post‐test were performed; *** p <0.001, ** p < 0.01, and * p < 0.05 were considered to be significant.
