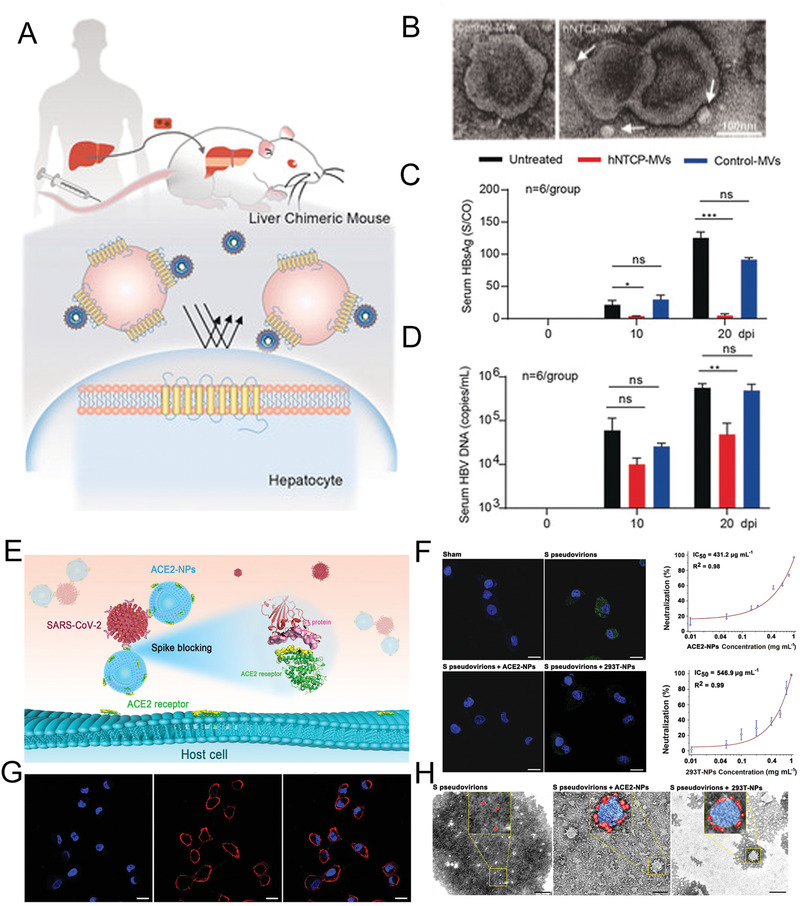
Figure 3.

The antiviral treatment for HBV infection with genetically engineering hNTCP‐Bio‐MVs. A) Design of HBV‐infected Hu‐FRGS mice that received hNTCP‐Bio‐MVs treatment. B) TEM images of HBV‐hNTCP‐Bio‐MVs complexes negatively stained with uranyl acetate. C,D) Serum HBsAg and HBV DNA levels of untreated, Bio‐MVs treated, and hNTCP‐Bio‐MVs treated Hu‐FRGS mice with HBV infection from 0 to 20 dpi. Reproduced with permission.[ 72 ] Copyright 2018, Wiley‐VCH. E) The schematic diagram of ACE2 anchoring Bio‐MVs to block SARS‐CoV‐2 infection. F) Inhibitory effect of ACE2 anchoring Bio‐MVs was evaluated via immuno‐fluorescence microscopy. S pseudovirions were traced by a FITC‐labeled antibody (green). Nuclei were stained with DAPI (blue). The scale bar is 20 µm. G) Immunofluorescence microscopy showing the location of ACE2 (red) in HEK‐293T‐ACE2 cells. Nuclei were stained with DAPI (blue). The scale bar indicates 20 µm. H) TEM images of S pseudovirions adsorbed onto NPs. The scale bar indicates 200 nm. Reproduced with permission.[ 75 ] Copyright 2018, American Chemical Society.
