
Figure 3.
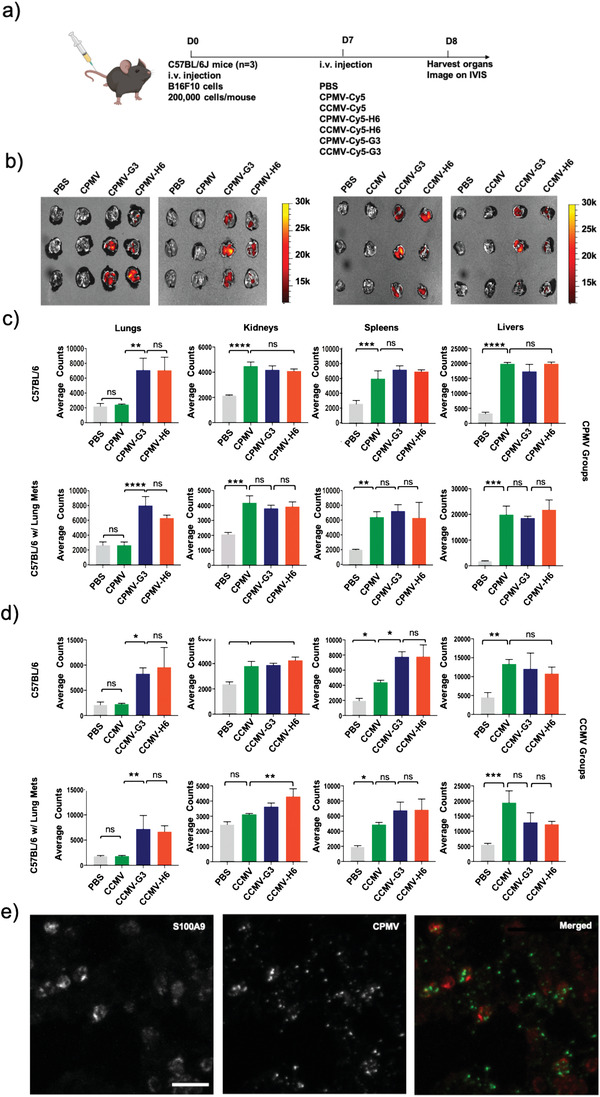
Biodistribution and localization of fluorescent CPMV and CCMV nanoparticles following administration. a) Schematic and timeline of the biodistribution study. b) IVIS imaging of lungs following CPMV and CCMV nanoparticle injection. Quantitative analysis of the fluorescence signal from the organs after c) CPMV and d) CCMV nanoparticle injection. e) Confocal imaging indicates co‐localization of the CPMV‐Cy5‐G3 particles with S100A9. Scale bar represents 5 µm. The merged image shows the S100A9 in red and the CPMV in green. All experiments contained a sample size of n = 3 and significance was deemed as p < 0.05. All analyses were performed by one‐way analysis of variance (ANOVA). * = p < 0.05, ** = p< 0.01, *** = p < 0.001, **** = p < 0.0001, ns = not significant. All instances of CPMV and CCMV in Figures (b–d) are fluorescent nanoparticles, but were not labeled as Cy5‐conjugated to improve image simplicity. The image of the mouse is created with BioRender.com.