
Figure 4.
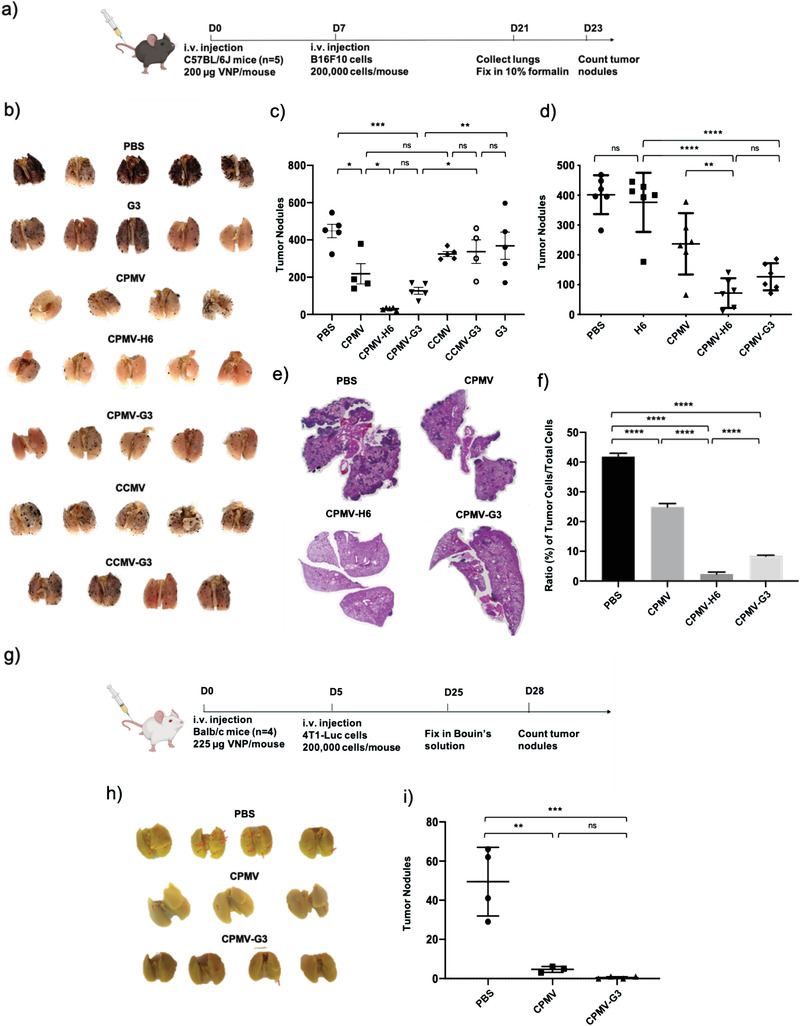
CPMV particles show immunoprophylaxis in C57BL/6J mice challenged i.v. with B16F10 melanoma or 4T1‐Luc breast cancer cells. a) Schematic and timeline of the B16F10 prophylaxis study. b) Harvested lungs were fixed and imaged before manual tumor counting. c) Quantitative analysis of the number of tumor nodules found on the surface of the lungs. The + sign indicates the mean while the solid horizontal line indicates the median. d) Repeated B16F10 prophylactic immunotherapy study including an H6 peptide only control. The middle line indicates the mean number of tumor nodules. e) H&E images of the harvested lungs. The dark purple spots are indicative of the B16F10 tumor nodules in the lungs. f) Quantitative analysis of the H&E pictures in e). The ratio of tumor cells to total cells within the H&E images were plotted. The images were analyzed using QuPath software. g) Schematic and timeline of the 4T1‐Luc prophylaxis study. h) Harvested lungs were fixed in Bouin's solution before manual tumor counting. The tumor nodules are highlighted by the red arrows. i) Quantitative analysis of the tumor nodules from the lungs in h). All B16F10 experiments had a sample size of n = 4–5 while 4T1‐Luc experiments were accomplished with a sample size of n = 4. All analyses were done by one‐way ANOVA, and significance was deemed as p < 0.05.* = p < 0.05, ** = p < 0.01, *** = p < 0.001, **** = p < 0.0001, ns = not significant. The image of the mouse is created with BioRender.com.