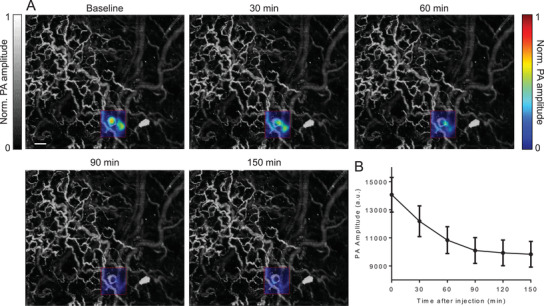
Figure 4.

In vivo PAM of caspase‐3 activity in a mouse ear tumor. A) Representative PAM images of the mouse ear at selected time points. Pseudocolor shows the PA signals in the tumor area. Scale bars, 200 µm. The images were taken every 30 min. B) PA signals at the tumor region decrease after STS‐induced apoptosis. n = 3 mice, error bar, s.e.m.
