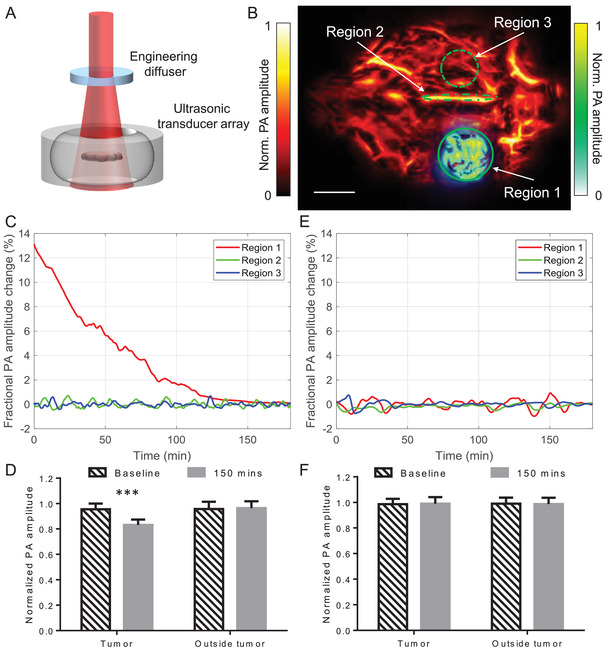
Figure 5.

PACT of caspase‐3 activity in a mouse brain tumor expressing miRFP670‐iRFP720 caspase‐3 biosensor during STS‐induced apoptosis. A) Setup of PACT. B) PACT image of a mouse brain 2‐h post‐injection, where the tumor was highlighted by computing the difference from the baseline image. STS was injected locally into the tumor to induce apoptosis. Scale bar, 2 mm. The three regions are the tumor area on the left hemisphere (Region 1), the biggest vessel in the brain (superior sagittal sinus, Region 2), and the region contralateral to the tumor (Region 3). C) PA signal changes after STS‐induced apoptosis. PACT measurements were acquired at 1 Hz frame rate. D) Statistics of PA signals before and after treatment. n = 3 mice, error bars, s.e.m. ***, p < 0.001, calculated using a paired Student's t‐test. E) PA signal changes after PBS injection. PACT measurements were acquired at 1 Hz frame rate. F) Statistics of the control group. n = 3 mice, error bars, s.e.m.
