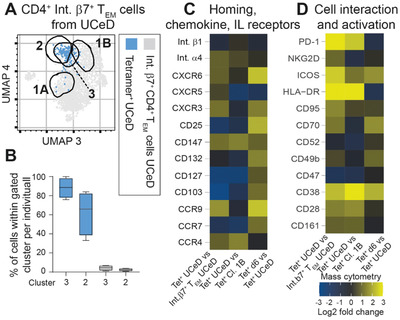
Figure 3.

Phenotype of HLA‐DQ2.5:gluten tetramer‐binding (Tet+) cells of untreated CeD versus treated CeD before and after gluten challenge. A) Mass cytometry‐derived UMAP plot (generated from plot of Figure 2A) visualizing only integrin β7+ effector memory T (TEM) cells from untreated CeD patients. Location of cluster 3, defining most Tet+ cells in untreated celiac disease (UCeD) patients versus location of clusters 1A, 1B, and 2, which defined Tet+ cells on baseline and day 6 after gluten challenge. B) Percentage of Tet+ from 4 UCeD patients locating within clusters 2 and 3, respectively. The 28 markers used to create the plot are visualized with their staining distribution in Figure S3 (Supporting Information). C,D) Heat map depicting log2 fold change of markers analyzed by mass cytometry comparing cell types as indicated. All data include integrin β7+ CD4+ TEM cells only.
