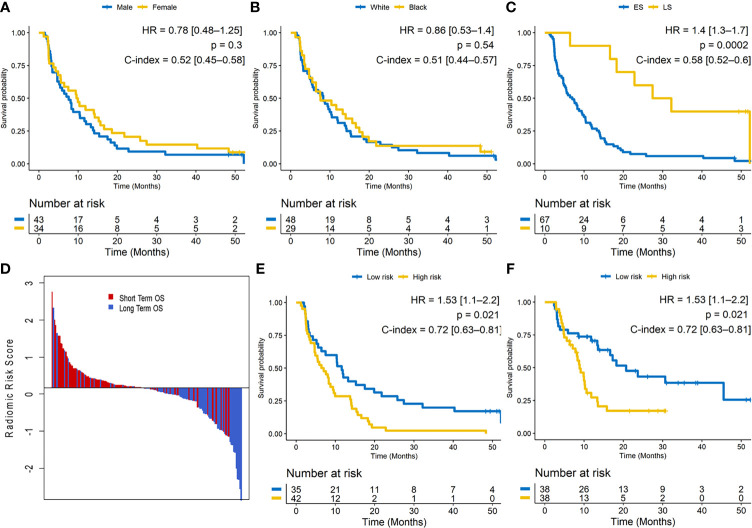
Figure 2.
(A–C) Kaplan–Meier survival curves for gender, race, and clinical stage on the training set. ES, extensive stage; LS, limited stage. (D) Waterfall plot of the length of overall survival (OS) based on radiomic risk score (RRS); higher risk score is associated with lower OS. (E) Kaplan–Meier survival curves based on the training set and (F) test set. A significant association of the radiomic risk score with the OS is shown in the training set and test set.

