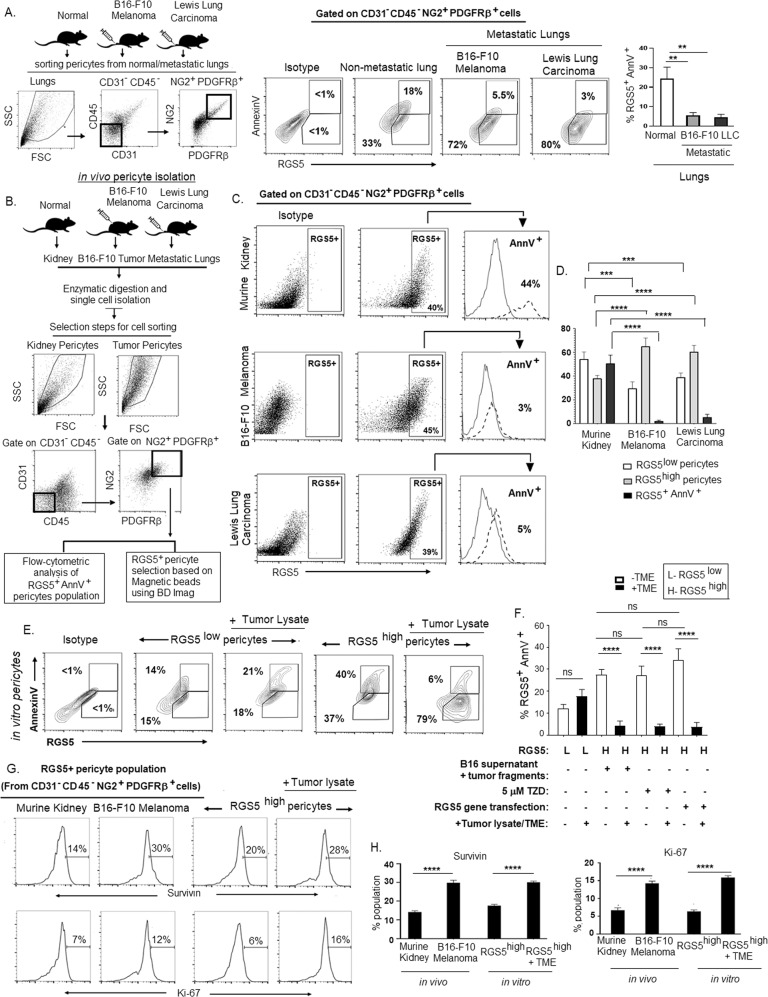
Fig. 3. RGS5highpericytes survive and proliferate within TME.
A Dot plots representing selection steps of sorting of pericyte population from murine normal and metastatic lungs, established in C57BL/6 mice by inoculation of B16-F10 melanoma and LLC via tail vein. Representative contour plots show RGS5+AnnV+ population in metastatic lungs versus non-metastatic lungs as checked by flow cytometry in CD31-CD45-NG2+PDGFRβ+ gated population. Bar diagrams represent mean± SD (n = 6) of RGS5+AnnV+ cells in murine normal and metastatic lungs. **p < 0.01. B Dot plots representing selection steps of sorting pericyte population from murine kidney, B16-F10 melanoma and LLC. C Representative dot plot show RGS5+pericyte population in normal murine kidney, B16-F10 melanoma and LLC tumors. Histograms on right side representing AnnV+ population in RGS5+ pericytes gated on CD31-CD45-NG2+PDGFRβ+sorted pericytes from different murine tissue/tumor microenvironment by the procedure described in (B). D Bars indicating mean± SD of percent RGS5low, RGS5high, and RGS5+AnnV+ population in pericytes sorted by the procedure described in (B) from three individual experiments. Statistical significance is attained by two-way ANOVA followed by Tukey’s multiple comparison test. ***p < 0.001,****p < 0.0001. E Representative contour plots show RGS5+AnnV+ population upon exposing RGS5highpericytes (generated as in Fig. 1A) to tumor-lysate. F Bars represent mean± SD of percent of RGS5+AnnV+ pericyte population on exposing RGS5highpericytes as generated in Fig. 1A–C to B16-F10 tumor-lysate (n = 6) obtained by one-way ANOVA followed by Tukey’s comparison test. ****p < 0.0001 and ns is not significant. G, H Representative histograms and bars show expression and mean± SD (n = 6) of percent of survivin and Ki-67 as analyzed by flow cytometry in RGS5highpericytes sorted from in vivo B16-F10 melanoma versus murine kidney (as in Fig, 3B) and in vitro RGS5highpericytes exposed to tumor-lysate versus RGS5highpericytes (generated as in Fig. 1A). ****p < 0.0001 as significant.

