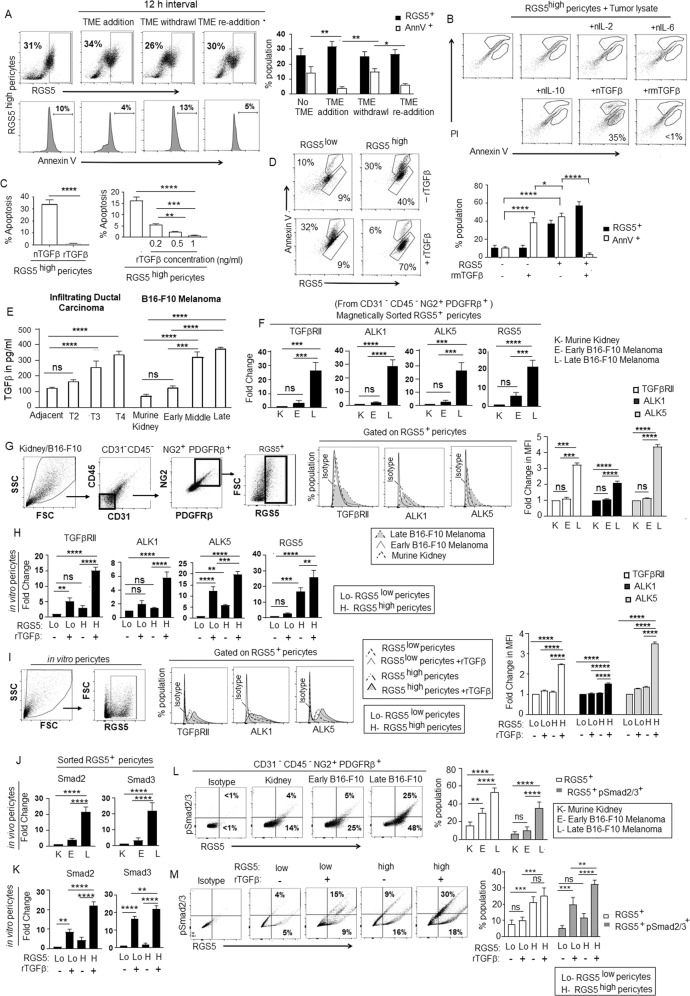
Fig. 4. TGFβ appeared as a critical factor within TME for switching pro- to anti-apoptotic behavior of RGS5highpericytes.
A Microenvironment dependency of RGS5-mediated apoptotic pathway. RGS5highpericytes (generated upon exposure to B16-F10 melanoma tumor supernatant+ tumor fragments (TME)) were subjected to withdrawal of TME for 12 h followed by re-addition of the same. RGS5 and AnnV expression in RGS5+ population was determined by flow cytometry. Representative dot plots show RGS5 expression and their respective histograms for AnnV+ population in RGS5highpericytes. Bars indicate mean± SD (n = 6) of percent of RGS5-expressing pericytes and AnnexinV positivity in RGS5highpericytes. B Determination of responsible factor(s) within TME for the anti-apoptotic switch, RGS5high pericytes were exposed to neutralizing anti-cytokine antibodies for IL-2, IL-6, IL-10, TGFβ and recombinant mTGFβ (1 ng/ml). Apoptosis was evaluated by AnnexinV-PI staining followed by flow cytometry. Illustrative dot plots show percentage of AnnexinV. C Bars representing mean± SD (n = 6) of percentage of AnnV+ pericytes upon TGFβ neutralization and rmTGFβ supplementation at different concentrations. **p < 0.01, ***p < 0.001, ****p < 0.0001. D Representative dot plots indicating percentage of AnnV+ in RGS5high/RGS5lowpericytes exposed to rTGFβ. Bars represent percent population of RGS5+ and AnnV+ pericytes after supplementation of rTGFβ to RGS5lowpericytes and RGS5highpericytes (generated as in Fig. 1A) in vitro.*p < 0.05, ****p < 0.0001. E Bars represent the TGFβ concentration (measured by ELISA) as mean± SD (n = 6) in tumors obtained from human infiltrating breast carcinoma of different stages and B16 melanoma with different tumor sizes as versus adjacent normal tissues and murine kidney respectively. ***p < 0.001, ****p < 0.0001. F Bars represent fold change in mRNA expression of TGFβRII, ALK1, ALK5, RGS5 in RGS5+ pericytes sorted from CD31-CD45-NG2+PDGFRβ+ pericytes population in murine kidney, early and late B16-F10 melanoma following steps described in Fig. 3B. G Dot plots represent the selection steps of RGS5+ pericytes sorted from CD31-CD45-NG2+PDGFRβ+ population in murine kidney, early and late B16-F10 melanoma. Histograms represent expression of TGFβRII, ALK1, ALK5 analyzed by flow cytometry in sorted RGS5+ pericytes and their fold change in MFI are presented as bar diagram (right) with mean± SD (n = 3). H Bars represent fold change in mRNA expression of TGFβRII, ALK1, ALK5, RGS5 in RGS5low, and RGS5highpericytes generated as described in Fig. 1A, with +/− rTGFβ-stimulation in vitro. I Dot plots represent the selection steps of RGS5+ pericytes in vitro. Histograms represent expression of TGFβRII, ALK1, ALK5 analyzed by flow cytometry in RGS5low and RGS5highpericytes generated as described in Fig. 1A, +/− rTGFβ-stimulation in vitro and their fold change in MFI are represented with bar diagram (right) with mean± SD (n = 3). J, K Bars obtained by one way ANOVA following Tukey’s comparison test represent fold change in mRNA expression Smad2 and Smad3 as determined from Ct values generated by quantitative real-time PCR, keeping β-actin as housekeeping gene in RGS5+ pericytes sorted from CD31-CD45-NG2+PDGFRβ+ pericytes population in murine kidney (K), early (E) and late (L) B16-F10 melanoma and in RGS5low and RGS5highpericytes with +/− rTGFβ-stimulation in vitro. L, M Dot plots represent RGS5+pSmad2/3+ percent population in RGS5+ pericytes sorted from CD31-CD45-NG2+PDGFRβ+ cells in vivo and in RGS5low and RGS5highpericytes +/− rTGFβ-stimulation in vitro. Bar diagrams obtained by two-way ANOVA following Tukey’s comparison test (on right) represent mean± SD percent population of RGS5+ and RGS5+pSmad2/3+ both in vivo and in vitro. *p < 0.05, **p < 0.01, ***p < 0.001, ****p < 0.0001, ns: not significant.

