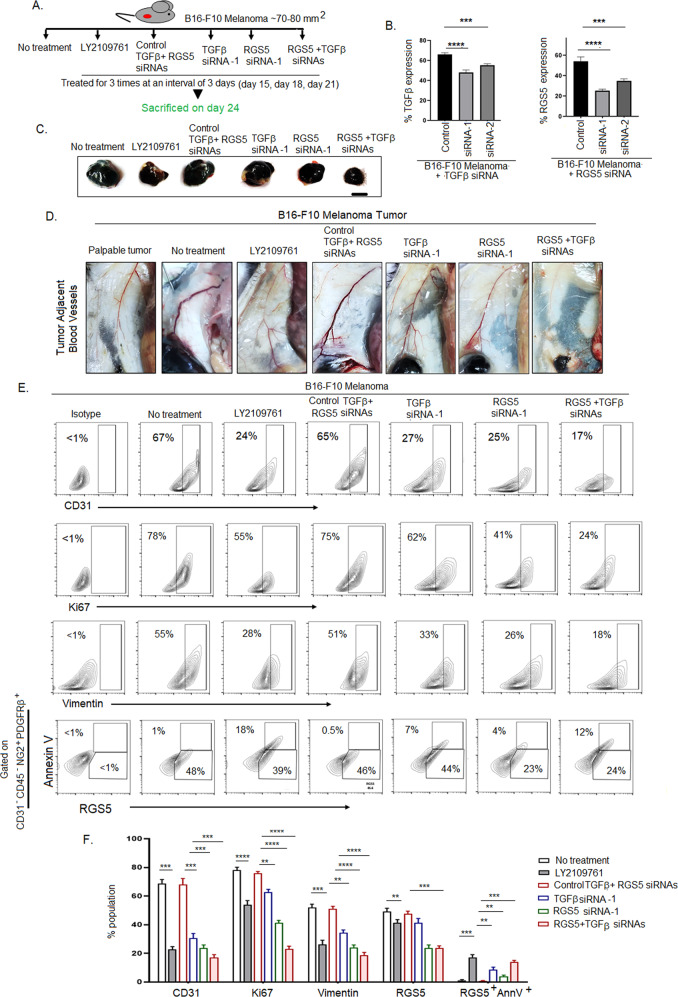
Fig. 8. Targeting RGS5-TGFβ axis restricts tumor growth.
A Pictorial diagram representing the in vivo experimental settings. Each group of mice (n = 6) bearing B16-F10 tumor were intratumorally injected with TGFβRs inhibitor (LY2109761), control RGS5 + TGFβ siRNAs, TGFβ siRNA, RGS5 siRNA, and both RGS5 + TGFβ siRNAs for 3 times at an interval of 3 days. B Bar diagrams representing mean + SD (n = 6) of percent expression of TGFβ and RGS5 upon treatment with respective siRNAs in comparison to control siRNAs by flow cytometry. ***p < 0.001, ****p < 0.0001. C Representative macroscopic images of tumor (n = 6) as obtained 3 days after last dose of inhibitor/siRNAs as described in (A). Scale bar indicates 5 mm. D Representative figures (n = 6) showing tumor adjacent blood vessels of B16-F10 melanoma tumor bearing mice as treated with inhibitor/siRNAs as described in (A) on day 24. E Illustrative contour plots indicating expression of CD31, Ki67, vimentin along with RGS5+AnnV+ pericyte population gated on CD31-CD45-NG2+PDGFRβ+ population as in Fig. 3B, respectively in tumors derived from (A). F Bars obtained by two-way ANOVA followed by Tukey’s multiple comparison test represent mean + SD of percent population of CD31, Ki67, vimentin, RGS5, RGS5+AnnV+ in B16-F10 melanoma tumor following treatment with LY2109761 and RGS5 + TGFβ siRNAs in comparison to no treatment and control siRNAs group respectively. **p < 0.01, ***p < 0.001 and ****p < 0.0001.

