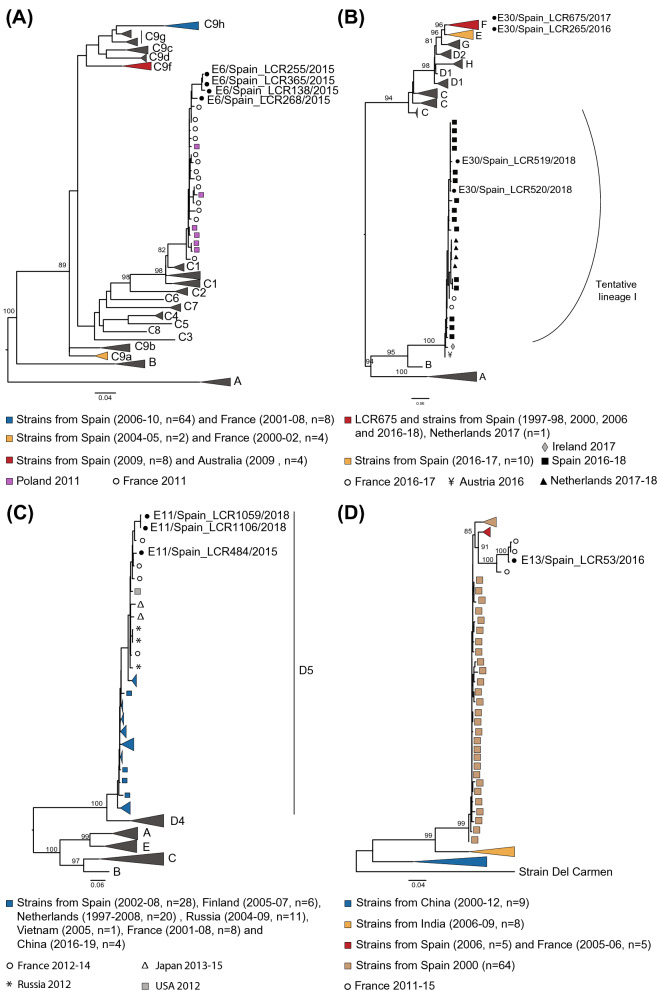
Figure 1.
Maximum-likelihood trees based on a partial VP1 inferred by IQ-TREE v.2.0.6 for the four genotypes study here: E6 (A), E30 (B), E11 (C) and E13 (D). Sequences reported in our study are indicated by black circles. Numbers on nodes indicate the bootstrap support of the node (> 80) and the scale bars represents the expected number of nucleotide substitutions per site. Non collapsed trees can be found in Supplementary Fig. 4A–D. Trees are annotated with the classification proposed by Smura et al. and Cabrerizo et al.10,19 for E6, the classification proposed by Bailly et al.20 for E30, and the classification proposed by Li et al.22 for E11. Only bootstrap values above 80% are indicated in branch nodes. Scale bars indicate nucleotide substitutions per site.

