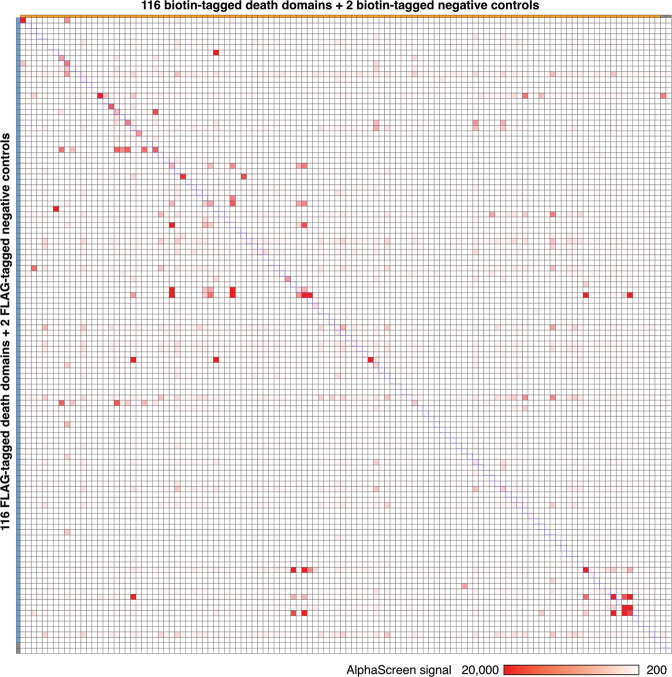
Fig. 3. Heat map displays all the ALPHA results.
There were 13,924 reactions between FLAG-tagged (116 domains plus 2 negative controls) and biotin-tagged (116 domains plus 2 negative controls) domains. The longitudinal axis shows FLAG-tagged domains and the horizontal axis shows biotin-tagged domains. The position of each point indicates the specific domain pair. Red points represent positive domain–domain interactions. The shade of red indicates the median value of two repeats in the ALPHA.

