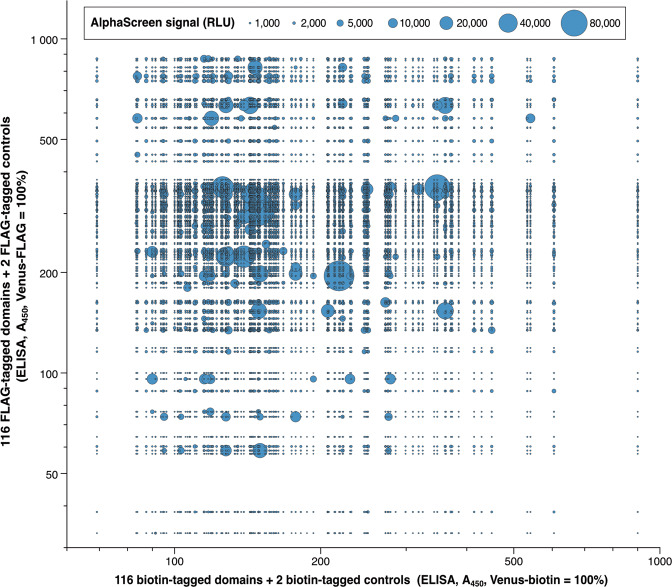
Fig. 6. The strength of ALPHA signals is not correlated with the expression levels of the domains, but with specific pair combinations.
A bubble chart compares the domain expression levels determined by ELISAs and the strength of ALPHA signals. Blue bubbles show ALPHA signals. The bigger the bubble area, the stronger the signal. The longitudinal axis shows relative concentrations of FLAG-tagged domains and the horizontal axis shows relative concentrations of biotin-tagged domains.

