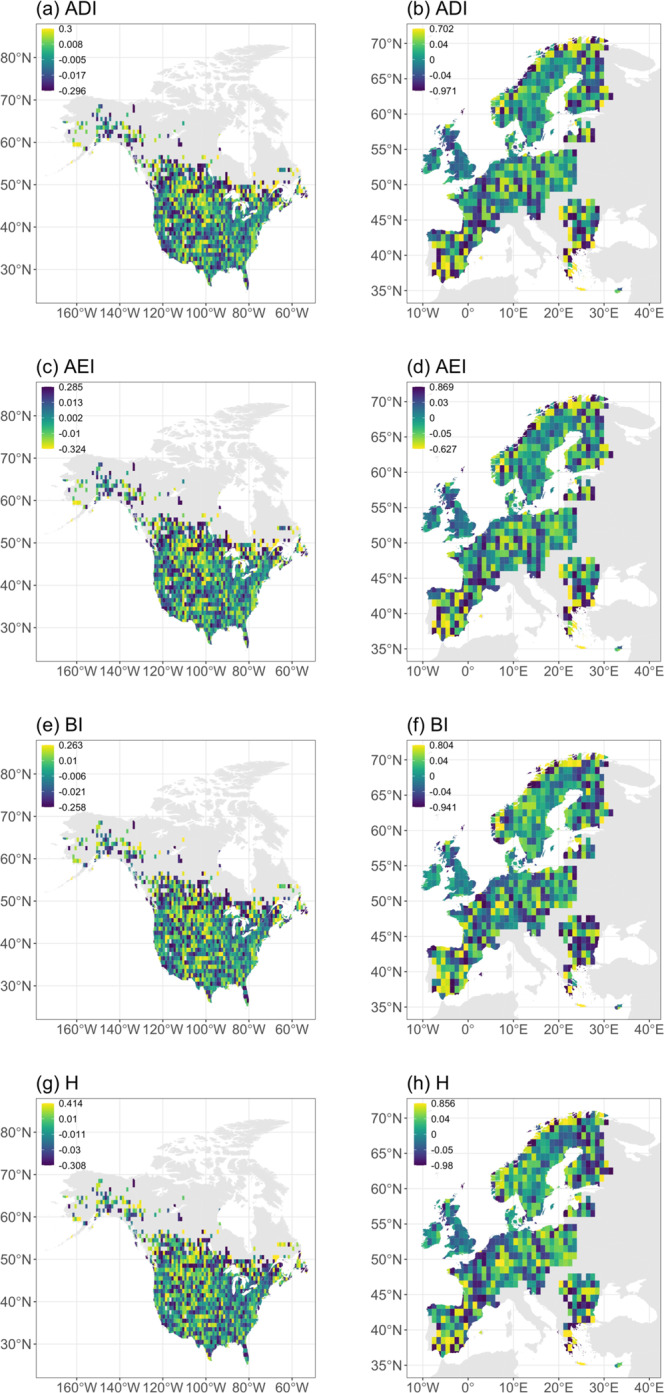
Fig. 4. Spatial variation in acoustic index trends.

Mean site-level trend in Acoustic Diversity Index, ADI (a, b), Acoustic Evenness Index, AEI (c, d), Bioacoustic Index, BI (e, f) and Acoustic Entropy, H (g, h) in 1354 1°x1° grid squares across North America between 1996 and 2017 and 715 1°x1° grid squares across Europe between 1998 and 2018. Colours indicate the size and direction of trend in each acoustic index (yellow—improving soundscape quality; blue—declining soundscape quality); note that the colour scheme is reversed for AEI, as positive trends are taken to represent a reduction in soundscape quality for this index. Site-level trends are derived from changes in standardised annual values of each acoustic index.
