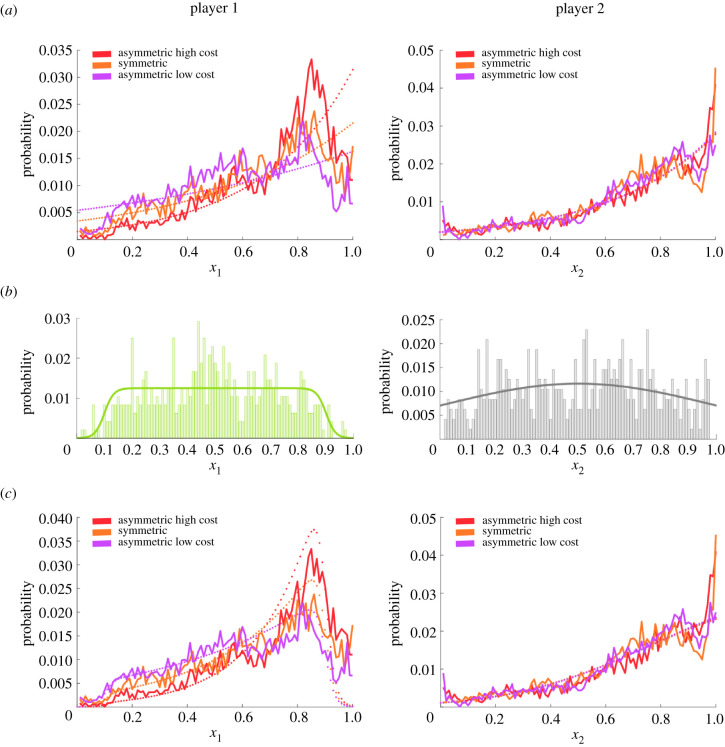
Figure 3.
Comparison of the marginal distributions over responses of each player to the equilibrium distributions predicted by the quantal response equilibrium. (a) The empirical frequencies of players' responses (solid lines) are compared to the quantal response equilibrium (dash lines) predicting no changes in the response distribution of player 2 and for player 1 elevated response frequencies near the Nash equilibrium in the asymmetric high cost condition, and accordingly suppressed response frequencies around the Nash equilibrium in the asymmetric low cost condition. (b) Players’ priors represented by histograms over initial positions in the first trials of each block of 40 trials. The solid lines represent simple analytic representations of the priors. (c) Quantal response equilibrium considering players' priors (dashed lines) compared to the same data (solid lines). (Online version in colour.)

