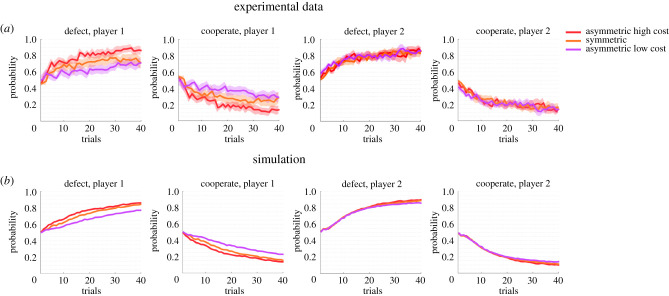
Figure 4.
Temporal evolution of players’ responses. (a) Evolution of each player's probability of defecting and cooperating across a set of 40 trials. The shading indicates one standard error of the mean across subjects. (b) Evolution of the probability of defecting and cooperating for two simulated Q-learning players.

