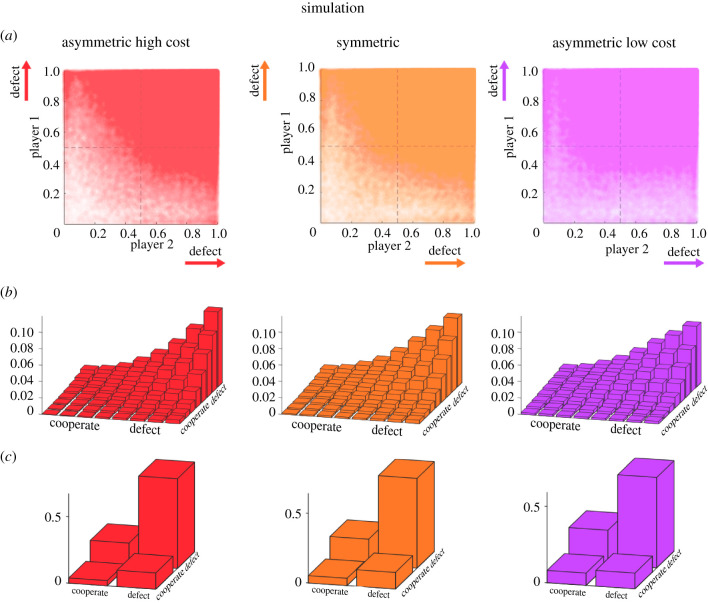
Figure 5.
Simulated Q-learners. (a) Scatter plots of the final decisions in the x1x2-plane for the three games, where actions are expected to cluster around the single pure Nash equilibrium located in the top-right corner at position (1,1). (b) Two-dimensional histograms of the simulated scatter plots. (c) Final decisions in terms of binary categorizations. (Online version in colour.)

