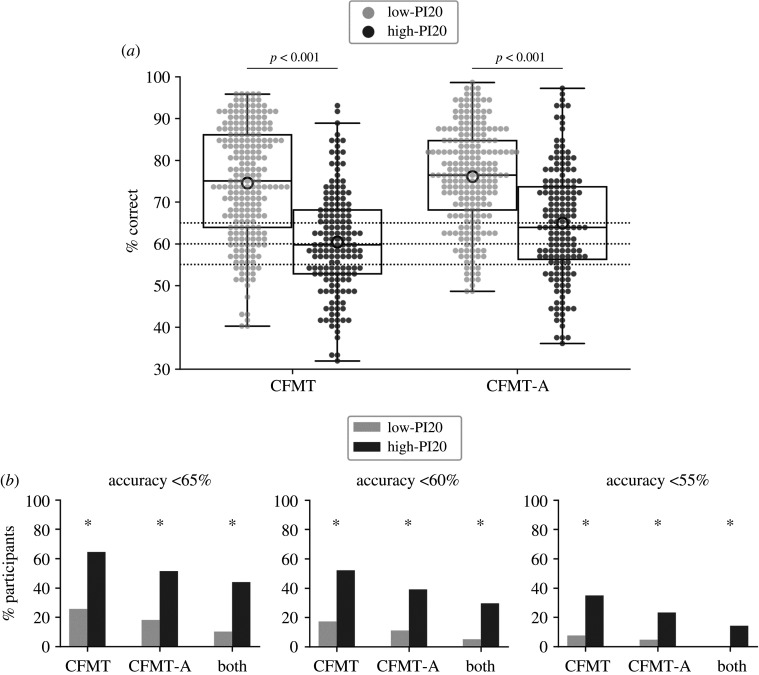
Figure 1.
Summary of the results for the low-PI20 versus high-PI20 scorers. (a) Performance on the CFMT and CFMT-A. Boxes show the median and interquartile range, circles show the mean and dotted lines indicate the three CFMT cut-off scores used in the analysis: 65%, 60% and 55%. (b) Proportion of participants scoring below each cut-off in the CFMT, in the CFMT-A and in both tests. Asterisks indicate significant chi-square tests after controlling for the FDR (p ≤ 0.001).

