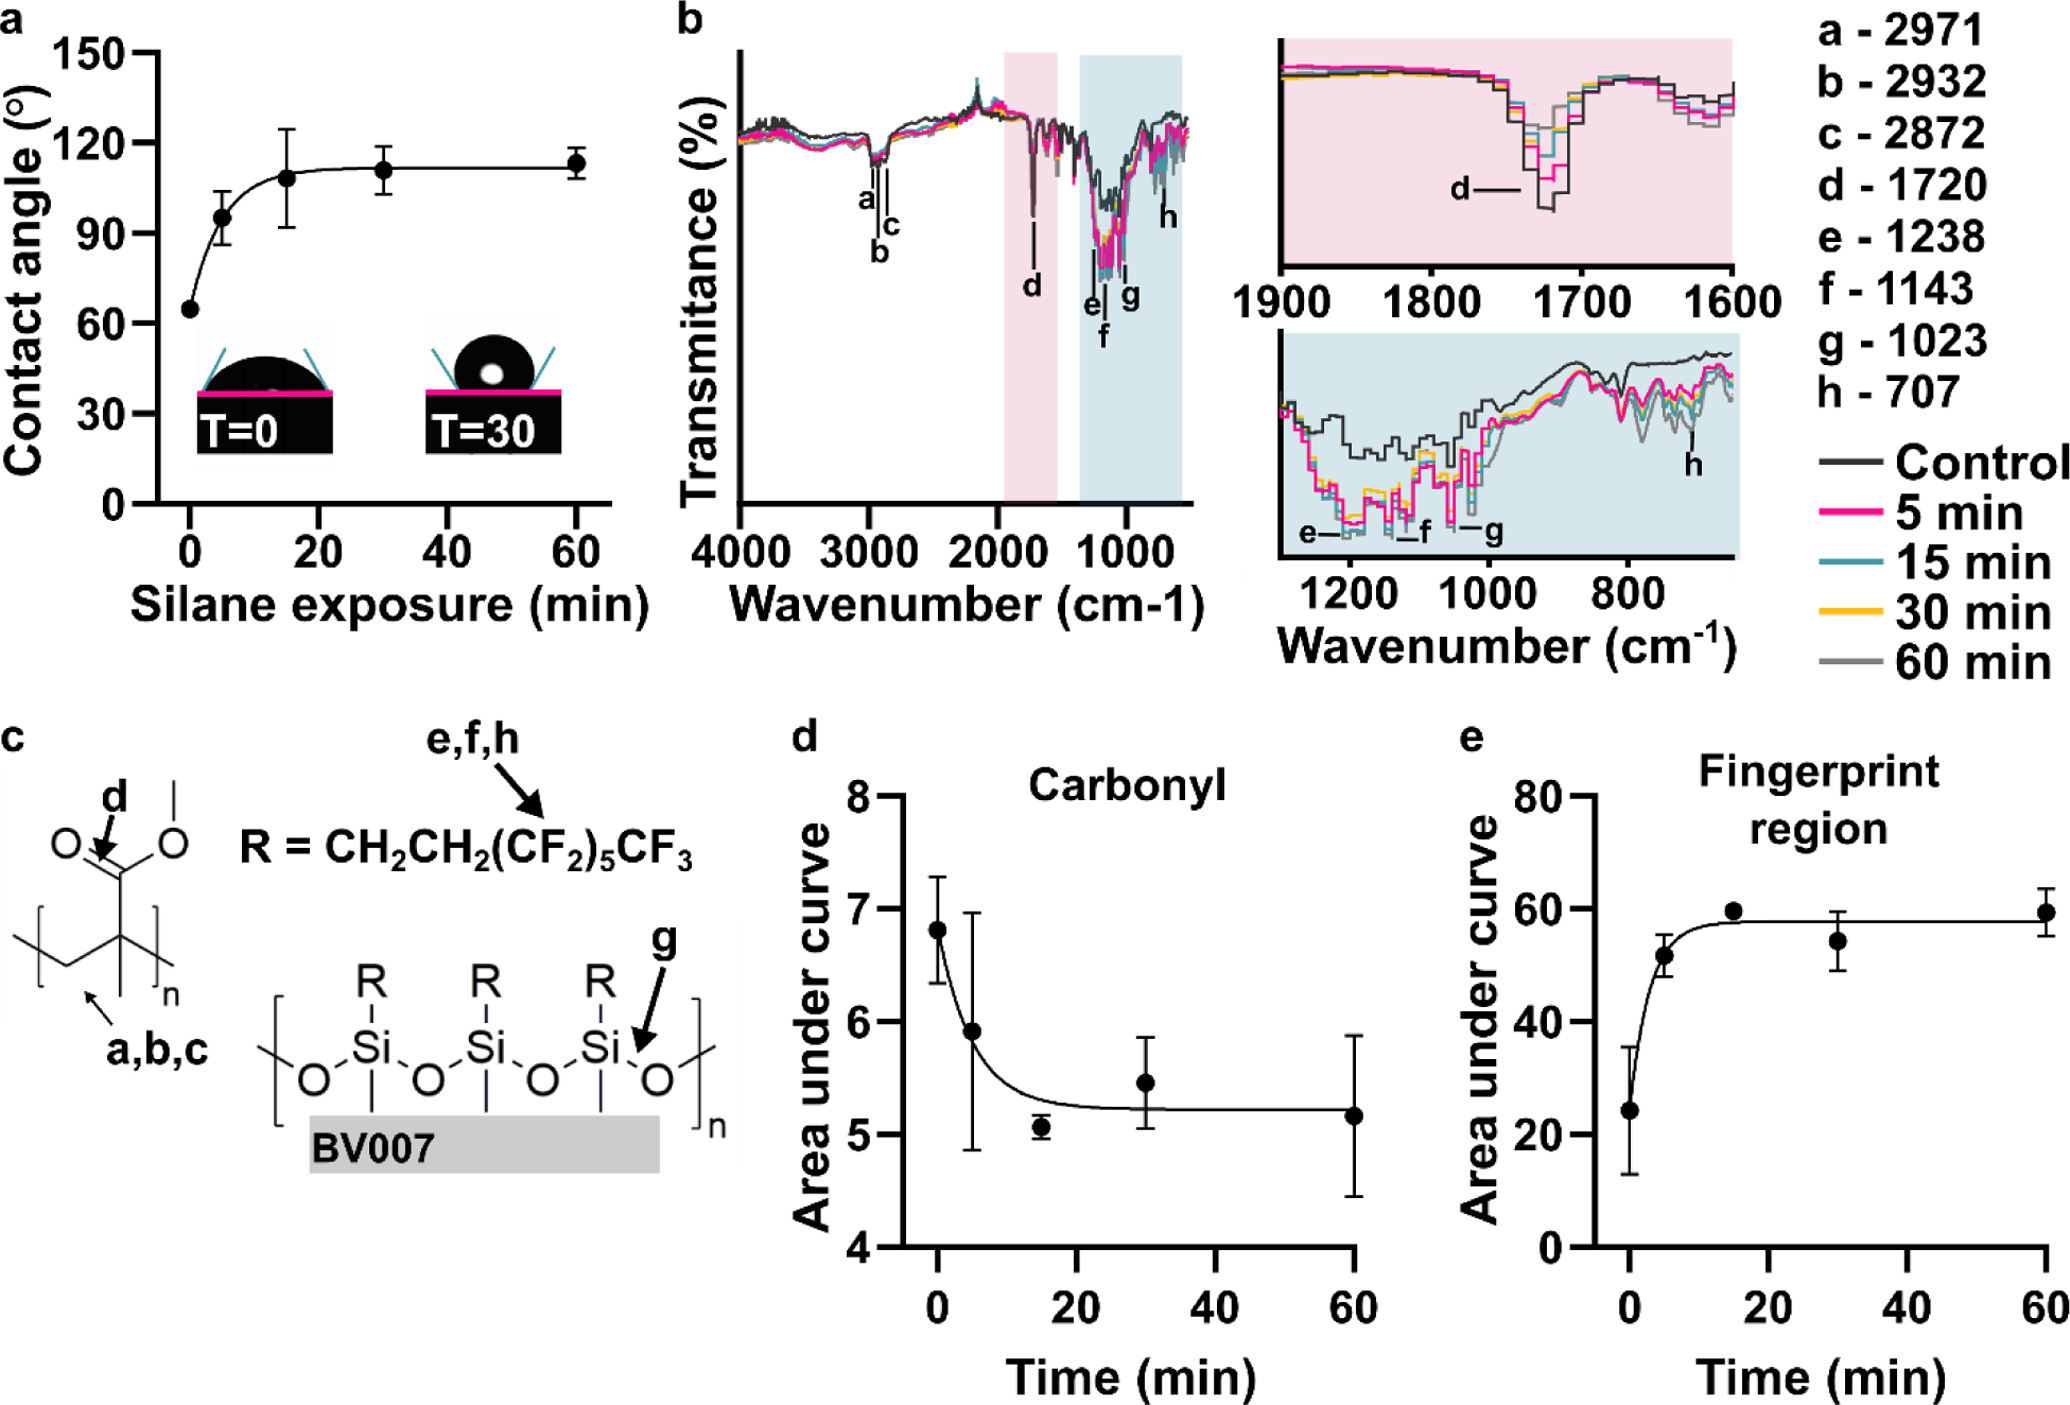
Figure 2:

Time dependence of the chemical reaction. (a) Contact angle of the fluorinated surface after various amount of silane treatment (n=3, mean ± std dev). The data were fit to an exponential curve, y = 111 – 46.9e−0.201x, R2 =0.844. Insets show images of droplets on BV-007A surface after 0 and 30 min of silanization. (b) ATR-FT IR spectrum of printed BV-007A pieces after various times of silane treatment. Two regions of interest are highlighted: the carbonyl peak at 1720 cm−1 and the finger print regions 650–1300 cm−1. (c) The chemical structures present in a methyl methacrylate-based resin and from the fluoroalkyl are labeled with the corresponding IR spectra peak. (d) The area under the carbonyl peak decreased in a time-dependent manner (n=3, mean ± std dev), fit to an exponential decay y = 55.9e−0.115x +43.3, R2 = 0.936. (e) The area under the curve of the finger print region increased in a time-dependent manner, fit to an exponential curve, y = 57.7 – 24.2e−0.348x, R2 =0.855.
