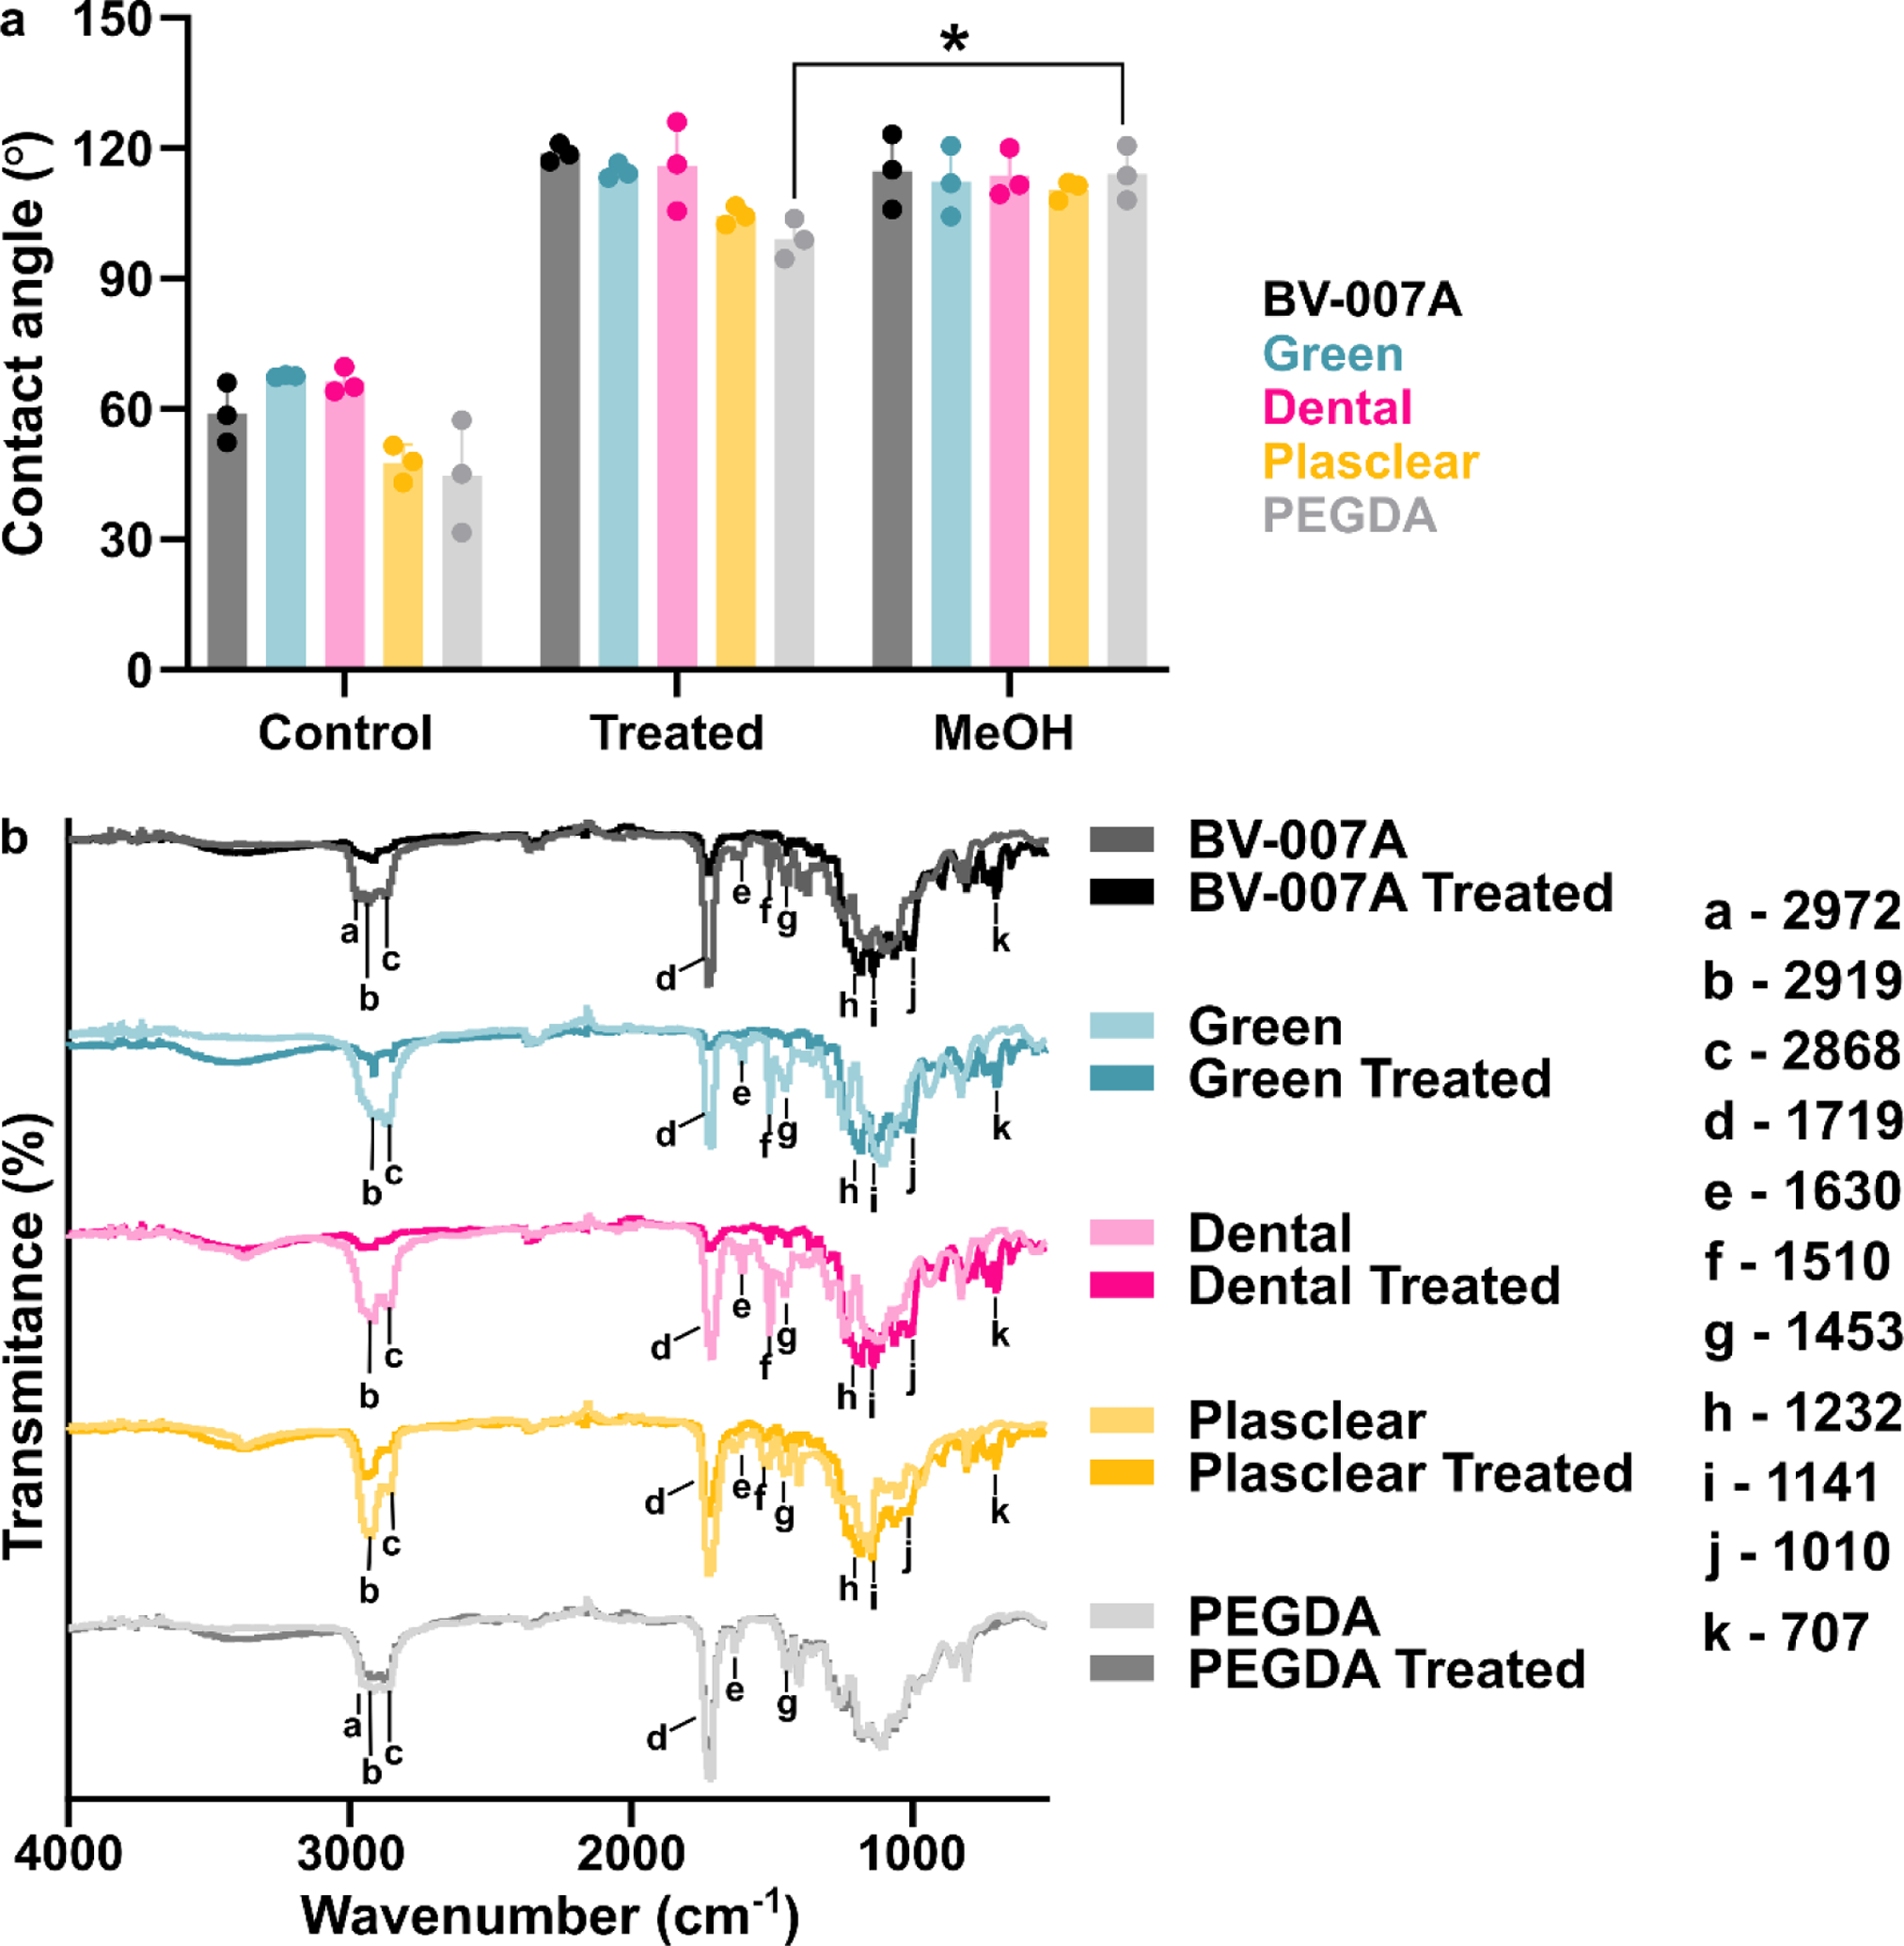
Figure 5:

Testing the optimized silanization method with a variety of SLA/DLP resins. (a) Air/water contact angles for resins prior to silanization, after silanization with the optimized procedure, and after soaking in methanol (n=3 printed parts for each condition, mean ± std dev). Two-way ANOVA with Tukey’s multiple comparisons tests (ns, p>0.05, ** p<0.005). (b) ATR FT-IR spectra of pieces printed using the various resins, before and after silanization (n=3 printed parts for each condition). Spectra are offset to display spectral features.
