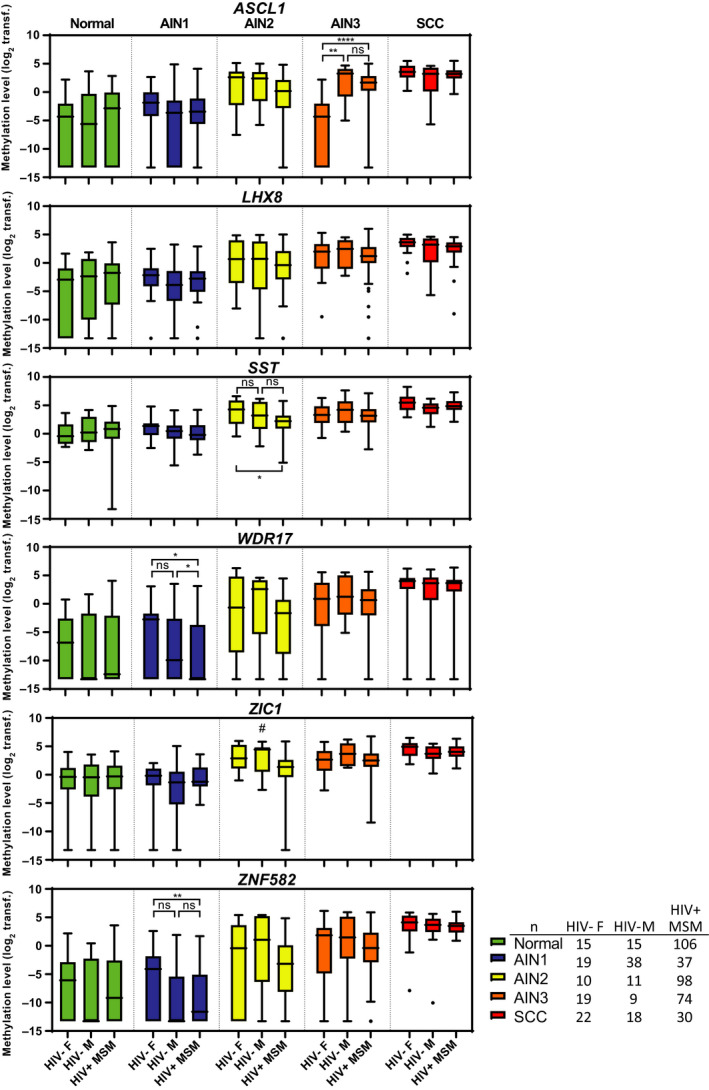
Fig. 2.

Methylation levels across samples of HIV‐negative women, HIV‐negative men and HIV+ MSM. Boxplots of DNA methylation levels relative to a reference gene ACTB (log2‐transformed ΔΔCq ratios; y‐axis) in the different histological categories of anal tissue samples of patient groups (x‐axis) for six markers: ASCL1, LHX8, SST, WDR17, ZIC1 and ZNF582. The box of the boxplots bounds the IQR divided by the median, Tukey‐style whiskers extend to a maximum of 1.5 IQR beyond the box, and ● marks an outlier sample. Differences between groups per histological categories are only visualised upon a significant Kruskal–Wallis omnibus test result and followed by post hoc testing using the Mann–Whitney U‐test and Bonferroni multiple testing correction. *P < 0.05, **P < 0.01, ****P < 0.0001, ns, nonsignificant. # P < 0.05 on Kruskal–Wallis test but individual comparison using the pairwise Mann–Whitney U‐tests with the Bonferroni correction was nonsignificant. AIN: anal intraepithelial neoplasia (grades 1–3); SCC: anal squamous cell carcinoma; F: female; HIV−: HIV‐negative; M: male; ; Normal: normal control samples; transf.: transformed.
