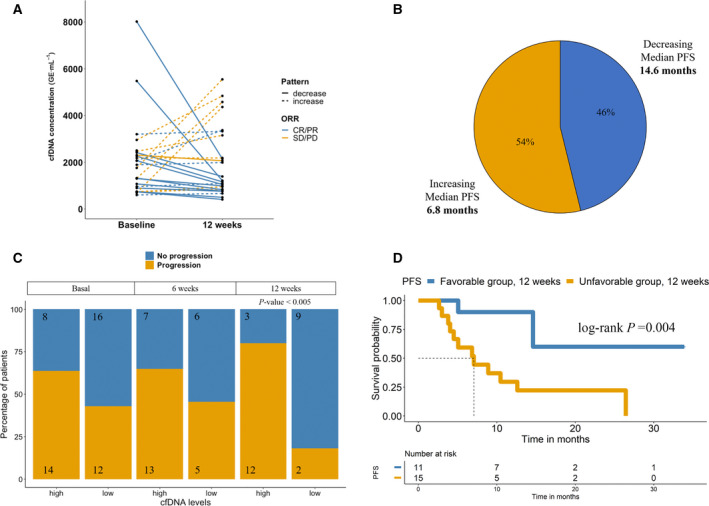
Fig. 4.

hTERT cfDNA changes from baseline to 12 weeks. (A) hTERT cfDNA concentrations for the two cfDNA patterns (increase/decrease at 12 weeks) and showing the response to therapy. (B) Percentage of patients and median PFS for each cfDNA pattern; (C) Proportion of patients with high and low levels baseline, 6 and 12 weeks. P‐value was calculated by Fisher’s exact test. (D) Kaplan–Meier plot of PFS of the favourable/unfavourable changes at 12 weeks. Groups are composed of patients with unfavourable changes: both high hTERT cfDNA levels at baseline (cut‐off ≥ 7.665) and at 12 weeks (cut‐off ≥ 7.026), or low levels at baseline (cut‐off < 7.665) and high levels at 12 weeks (cut‐off ≥ 7.026). The low‐risk group (patients with favourable changes) is composed of patients with low hTERT cfDNA levels at baseline (cut‐off < 7.665) and low levels at 12 weeks (cut‐off < 7.026) or high levels at baseline (cut‐off ≥ 7.665) and low levels at 12 weeks (cut‐off < 7.026). CR/PR, complete response/partial response; SD/PD, stable disease/progression disease.
