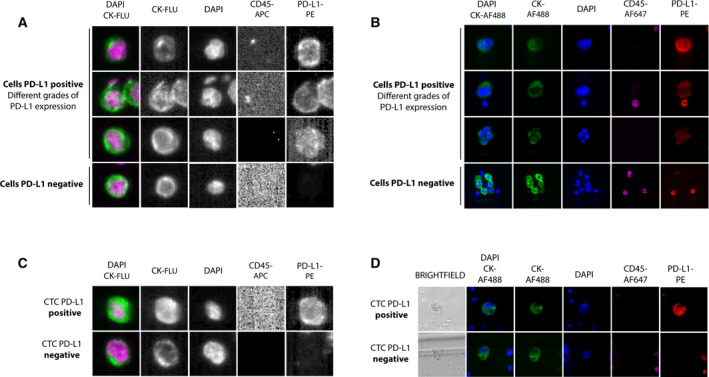
Fig. 5.

(A, B) Detection of PD‐L1 expression after spiking cancer cell lines in healthy blood and analysis of them with the CellSearch® and Parsortix systems, respectively, and representative images of different grades of PD‐L1 expression. (C) Representative images of CTCs detected with the CellSearch® system in patients with NSCLC. Samples were subjected to immunostaining with DAPI, CD45 (APC), cytokeratins (FLU) and PD‐L1 (PE). (D) Representative images of CTCs detected with the Parsortix system in patients with NSCLC. Samples were subjected to immunostaining with DAPI, CD45 (AF647), cytokeratins (AF488) and PD‐L1 (PE). NCI‐H460 stimulated with IFN‐γ shown high expression, NCI‐H460, medium expression, NCI‐H322, low–medium expression, and A549, no expression.
