Fig. 6.

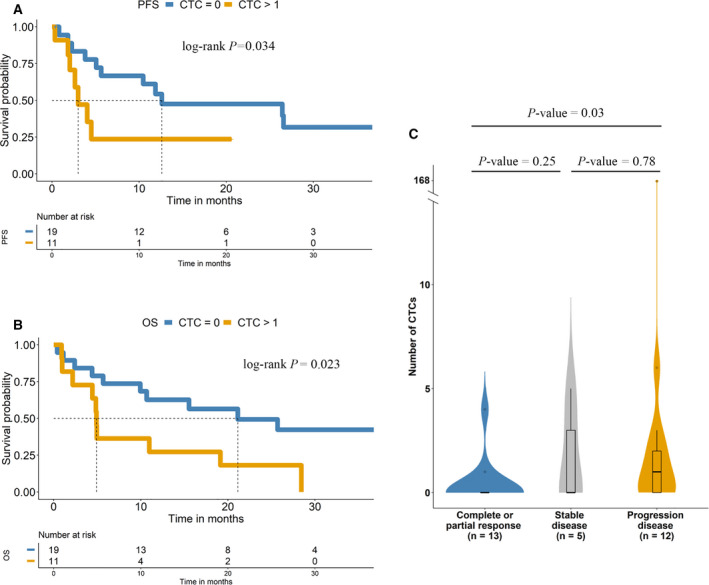
Kaplan–Meier survival analysis of CTCs at baseline. Kaplan–Meier plots of PFS (A) and OS (B). (C) Comparison of the response to pembrolizumab based on CTC detection using CellSearch®. P‐value was calculated by Fisher’s exact test.

Kaplan–Meier survival analysis of CTCs at baseline. Kaplan–Meier plots of PFS (A) and OS (B). (C) Comparison of the response to pembrolizumab based on CTC detection using CellSearch®. P‐value was calculated by Fisher’s exact test.