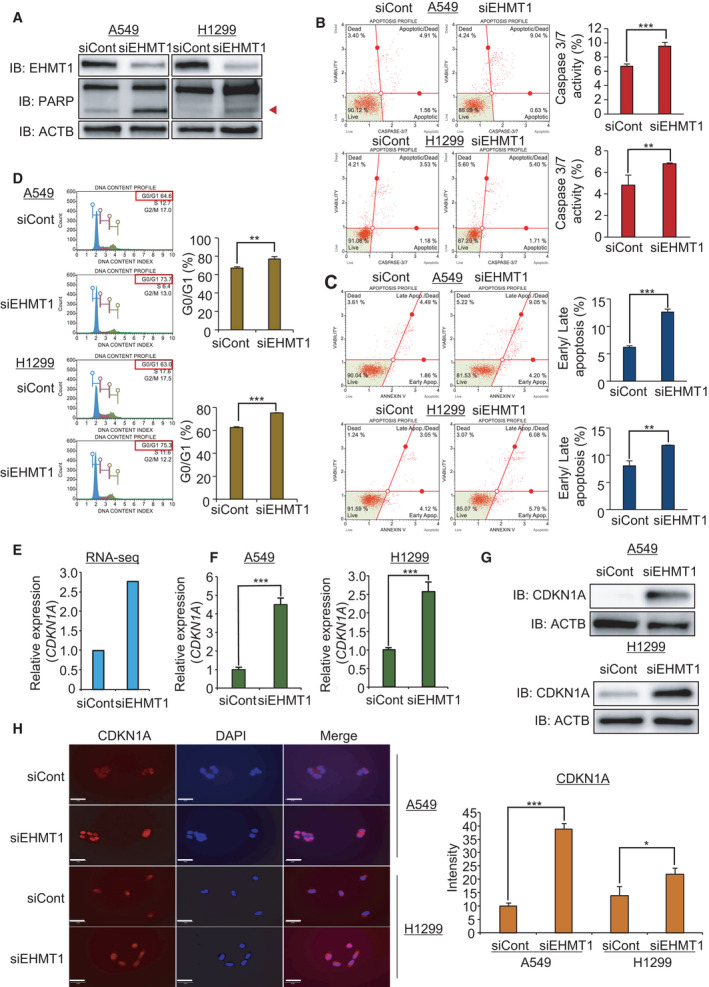
Fig. 3.

EHMT1 knockdown induces cell apoptosis and cell cycle arrest in A549 and H1299 cell lines. (A) Western blot analysis after siEHMT1 transfection using anti‐PARP and anti‐ACTB antibodies. ACTB was used as the internal control in A549 and H1299 cells. (Arrowhead: cleaved PARP) (B) FACS analysis using Muse Caspase‐3/7 working solution was performed after cells were transfected with siEHMT1 and siCont. The upper right panel indicates the apoptotic and dead cell proportions (left). The quantification of caspase‐3/7 activity. Mean ± SD of three independent experiments. The P values were calculated using Student’s t‐tests (***P < 0.001 and **P < 0.01) (right). (C) FACS analysis of Annexin V staining was carried out after cells were transfected with siEHMT1 and siCont. The lower right and upper right quadrants indicate early apoptosis and late apoptosis, respectively (left). The quantification of apoptosis. Mean ± SD of three independent experiments. The P values were calculated using Student’s t‐tests (***P < 0.001 and **P < 0.01) (right). (D) FACS analysis using propidium iodide after cells were transfected with siEHMT1 and siCont (left). The quantification of cell cycle. Mean ± SD of three independent experiments. The P values were calculated using Student’s t‐tests (**P < 0.01 and ***P < 0.001) (right). (E) RNA‐seq result of CDKN1A by EHMT1 knockdown. (F) qRT‐PCR analysis of CDKN1A expression after transfection of siEHMT1. Mean ± SD of three independent experiments. P values were calculated using Student’s t‐tests (***P < 0.001). (G) Western blot analysis after siEHMT1 transfection using anti‐CDKN1A and anti‐ACTB antibodies. ACTB was used as the internal control in A549 and H1299 cells. (H) Immunocytochemical analysis of CDKN1A. A549 and H1299 cells treated with siEHMT1 and siCont were fixed with 100% methanol and stained with anti‐CDKN1A (Alexa Fluor 568, red) and DAPI (blue). Scale bar, 50 μm (left). Quantification of CDKN1A expression in immunocytochemical analysis. Mean ± SD of three independent experiments. The P values were calculated using Student’s t‐tests (***P < 0.001 and *P < 0.05) (right).
