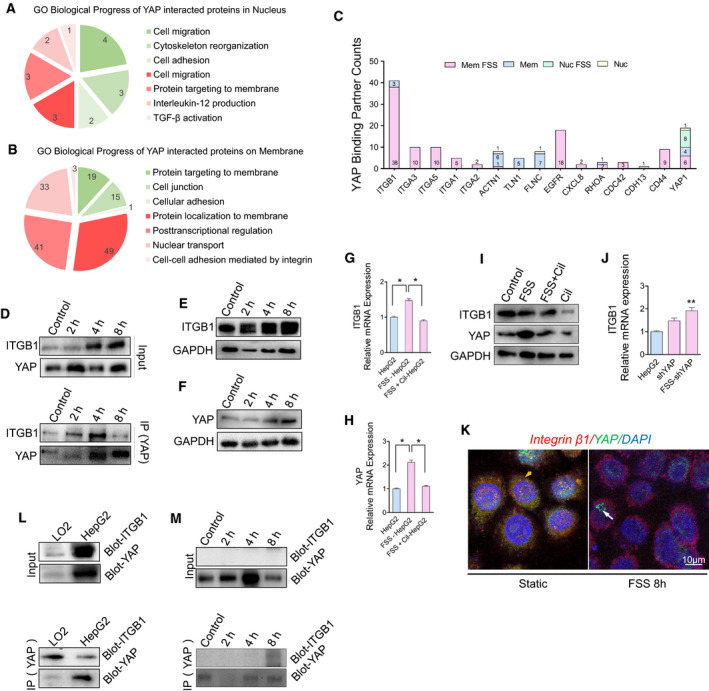
Fig. 5.

FSS triggers the release of YAP from integrin and its translocation to the nucleus. (A,B) BP analysis on the proteins identified in the label‐free quantitative proteomics analysis for YAP‐interacting proteins in the plasma membrane and nuclear fractions. (upregulation colored red, downregulation colored green). (C) Counts in the label‐free quantitative proteomics analysis for a panel of selected binding partners of YAP in response to FSS. (D) Co‐IP analysis of YAP and ITGB1 interaction in the membrane fraction of static cultured HepG2 and FSS‐HepG2 cells. (E,F) Western blotting analysis of YAP and ITGB1 in HepG2 cells treated with FSS for the indicated time durations. (G–I) The mRNA and protein levels of ITGB1 and YAP in HepG2, FSS‐HepG2 and FSS + Cil‐HepG2 cells treated with the integrin inhibitor cilengitide (n = 3). (J) FSS induces the mRNA level of integrin in cells with YAP knockdown (n = 3). (K) Immunostaining showing the colocalization of integrin and YAP under static and FSS conditions. The arrows indicated the location of YAP. (L) Co‐IP analysis of YAP and ITGB1 interaction in the membrane fraction of LO2 and HepG2 cells at the static state. (M) Co‐IP analysis of YAP and ITGB1 interaction in the nuclear fraction of static cultured HepG2 and FSS‐HepG2 cells. Data are shown as mean ± SEM (n = 3, by one‐way analysis of variance followed by Tukey test, *P < 0.05, **P < 0.01).
