
Fig 7.
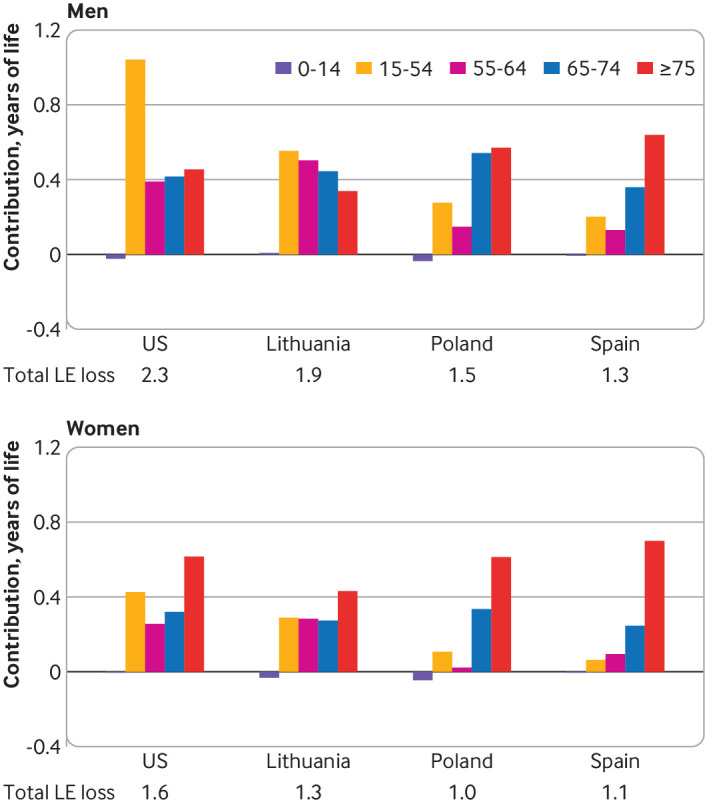
Age group components of difference between observed and expected life expectancy (LE) in 2020 among men and women in the United States and three comparator countries with the highest excess crude death rates in 2020. *Highest excess death rates according to Islam et al.22 The life table decomposition analysis was conducted using the Andreev-Arriaga-Pressat method50 51 52 53