
Figure 4.
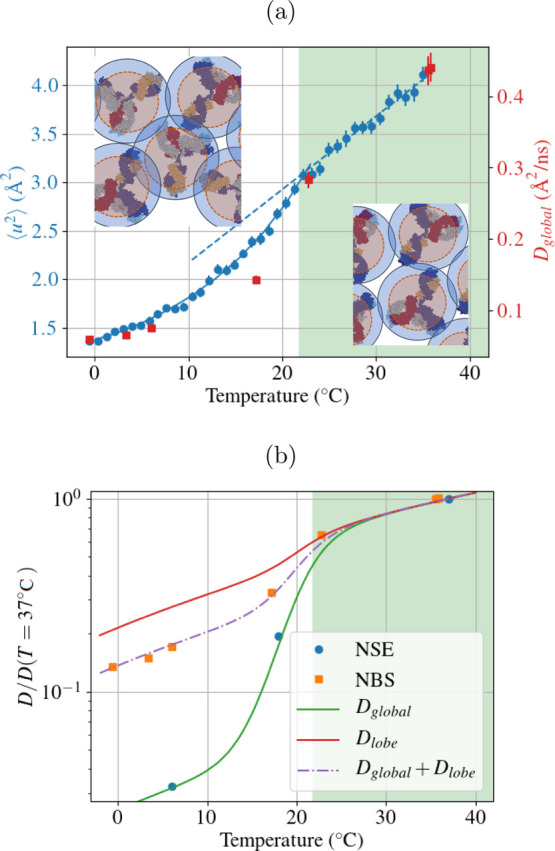
(a) In blue, the apparent mean square displacement (MSD) ⟨u2⟩ defined by eq 3, as a function of quench temperature is shown. The values were obtained by binning in a temperature range of 0.9 °C. In red, we show the global diffusion coefficient obtained with NBS on a q range of 5.8–18.2 nm–1. The green shaded area indicates the temperature range in which the solution is stable as a single phase, the dashed line is a linear fit of the points in the one-phase region, and the solid line is a guide to the eye. (b) Diffusion coefficient calculated with the two different techniques. The diffusion coefficient for NSE was calculated, averaging the diffusion coefficient at high q (in the range 1.3 nm–1 < q < 1.75 nm–1). We note that the same trend was seen for another sample for which the parent solution had a concentration of 8% PEG. The solid or dashed lines correspond to the fits according to eqs 6–8.