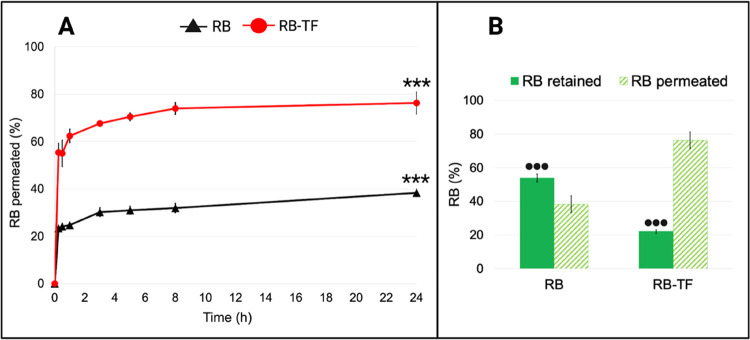
Figure 10.
Ex vivo epidermis permeation and retention profiles of RB aqueous solution and RB-TF dispersion. (A) The cumulative amount of RB aqueous solution (black line) and RB-TF dispersion (red line) permeated through the epidermis over 24 h (n = 3). RB-TF dispersion permeated after 24 h vs RB aqueous solution permeated after 24 h: p value < 0.0001(***). (B) Amount of RB aqueous solution and RB-TF dispersion retained by the epidermis (full green bar) and totally permeated (striped bar) at the end of the ex vivo permeation test (n = 3). RB-TF retained by the epidermis and RB aqueous solution retained by the epidermis: p < 0.0001(•••).

