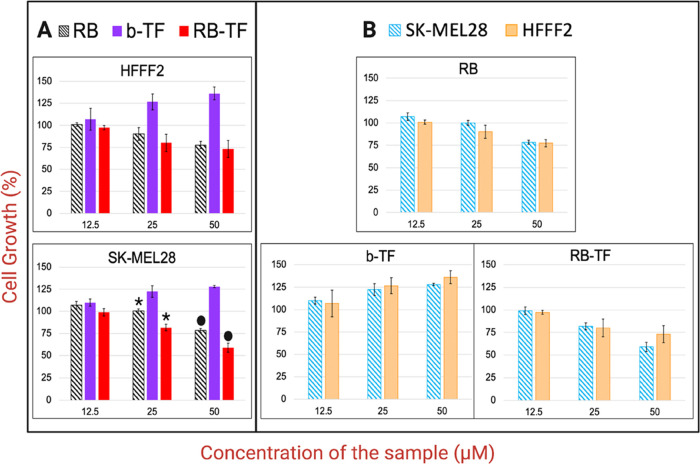
Figure 11.
Effects of RB aqueous solution, RB-TF, and b-TF on the SK-MEL28 and HFFF2 cell growth. Cells were cultured with samples for 48 h. (A) The viability of each cell line depending on the formulation and the concentration tested. (B) Analysis of each formulation’s impact at different concentrations, comparing the growth suppression of the two cell lines. The effect of RB aqueous solution (25 μM) on SK-MEL28 vs the effect of RB-TF (25 μM) on SK-MEL28: p value < 0.05 (*). The effect of RB aqueous solution (50 μM) on SK-MEL28 vs the effect of RB-TF (50 μM) on SK-MEL28: p value < 0.05 (•).

