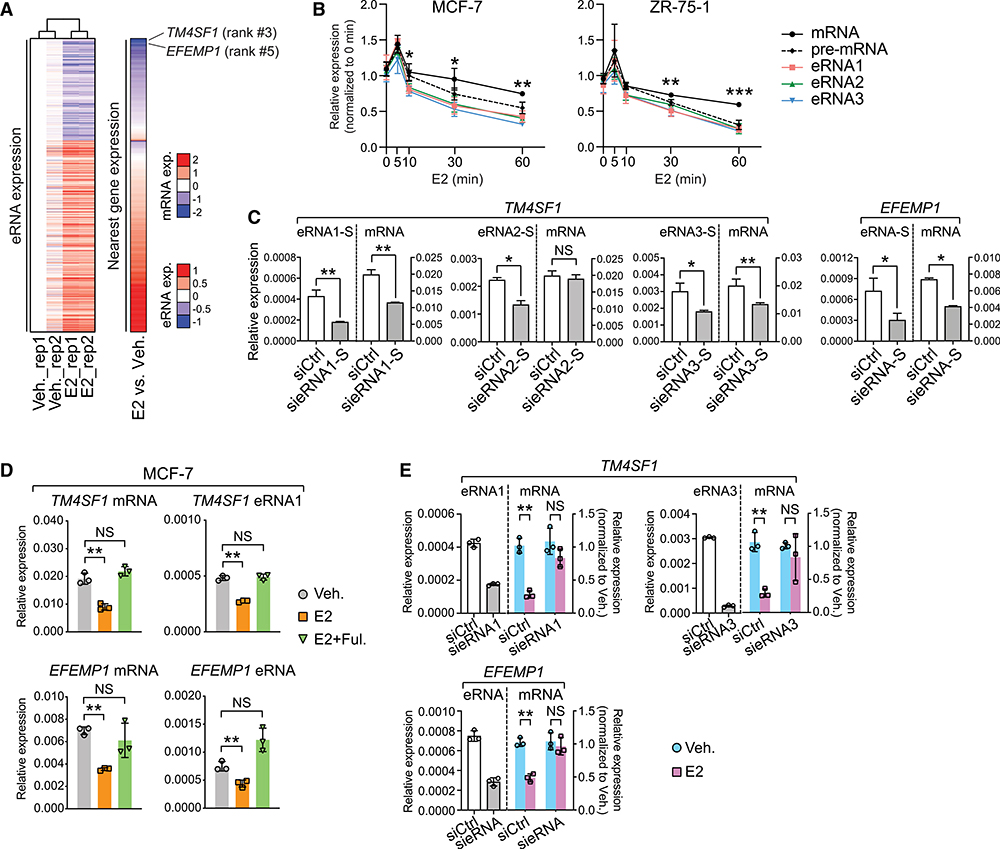
Figure 2. E2-Repressed eRNAs Play Essential Roles in the Regulation of E2-Mediated, ERα-Dependent Transcriptional Repression.
(A) Heatmaps showing expression levels of eRNAs and their nearest genes upon E2 treatment. eRNAs expression in two biological replicates (rep1 and rep2) was Z score transformed and normalized to rep1 under vehicle condition. The ranking of TM4SF1 and EFEMP1 was specified, and the scales of eRNA or mRNA expression (exp.) were indicated.
(B) Expression of mRNA, pre-mRNA, and eRNAs of TM4SF1 in breast cancer cells at different time points after 100-nM E2 stimulation. The forward and reverse primers for detecting TM4SF1 mRNA were designed based on sequences in exon 4 and 3, respectively, whereas the target sequences of the primers for detecting pre-mRNA are located in intron 3.
(C) Expression of sense (S)-strand eRNA and mRNA of TM4SF1 and EFEMP1 upon knock down of indicated eRNAs. The strand information was defined according to the transcription direction of the coding genes.
(D) Expression of specified RNA species in MCF-7 cells upon treatment with ethanol (Veh.), 1 nM estradiol (E2) for 3 h, or 1 nM estradiol and 1 μM fulvestrant for 3 h (E2 + Ful.).
(E) E2-induced expression changes in indicated mRNAs after knocking down the specified eRNAs in MCF-7 cells treated with 100 nM E2 for 3 h.
Data in (B)–(E) are presented as mean ± SD with three biological and technical replicates. Expression was all normalized to the GAPDH mRNA level. Statistical significance was calculated using the t test. *p < 0.05; **p < 0.005; ***p < 0.0005; NS, not significant.
Also see Figures S2 and S3.

