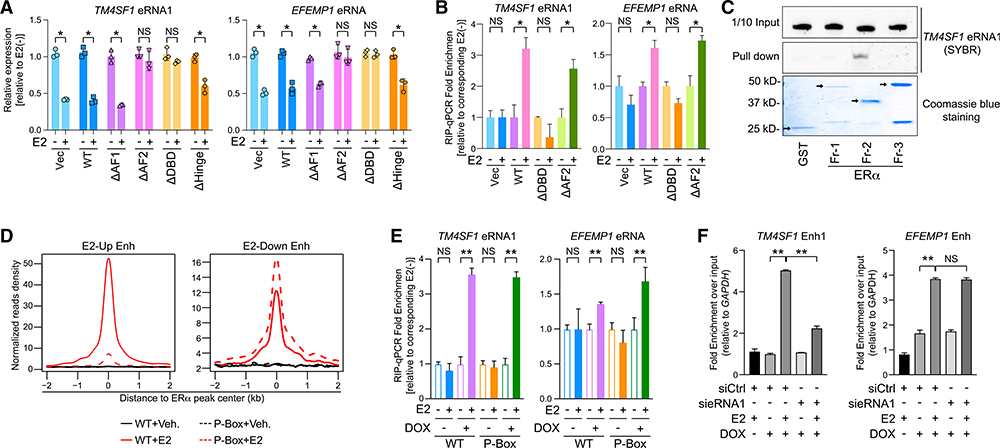
Figure 5. DNA-Binding Domain of ERα Mediates Its Association with E2-Repressed eRNAs.
(A) Expression of specified eRNAs in MCF-7 cells where endogenous ERα was replaced with hemagglutinin (HA)-tagged empty vector (Vec), wild-type ERα (WT), or different truncated forms with (+) or without (−) 100-nM E2 treatment for 3 h.
(B) RIP-qPCR analysis of indicated eRNAs in the anti-HA immunoprecipitates from MCF-7. The replacement system was the same as described in (A), and cells were treated with 100 nM E2 for 5 min.
(C) SYBR-gold staining of TM4SF1 eRNA1 in the input (1/10 input) or the pull-down samples from the mixture with indicated ERα truncation proteins by glutathione beads (Pull down). Bottom: Coomassie blue staining of GST protein (GST) and GST-tagged recombinant ERα fragments (Fr-1, −2, and −3). Arrows, specific protein bands.
(D) Aggregate plots of the ChIP-seq peak signals of the WT or the P-Box mutant (P-Box) at E2-upregulated (E2-Up Enh) or E2-downregulated enhancers (E2-Down Enh).
(E) RIP-qPCR showing the relative enrichment of specified eRNAs in the anti-FLAG precipitates from MCF-7 expressing inducible FLAG-tagged WT or P-Box.Cells were treated with 100 nM E2 for 5 min. The substituted proteins were induced by adding 2 μg/mL doxycycline (DOX) overnight.
(F) ChIP of inducible biotinylated P-Box ERα using streptavidin beads at indicated enhancers after knocking down TM4SF1 eRNA1 in MCF-7 upon 100-nM E2 treatment for 30 min. Condition of DOX induction was the same as in (E). Data were normalized to qPCR signals detecting the GAPDH promoter, a negative control site.
Data in (A), (B), (E), and (F) are presented as mean ± SD with three biological and technical replicates. </p/> p values were calculated by t test, *p < 0.05; **p < 0.001. Also see Figures S6 and S7.

