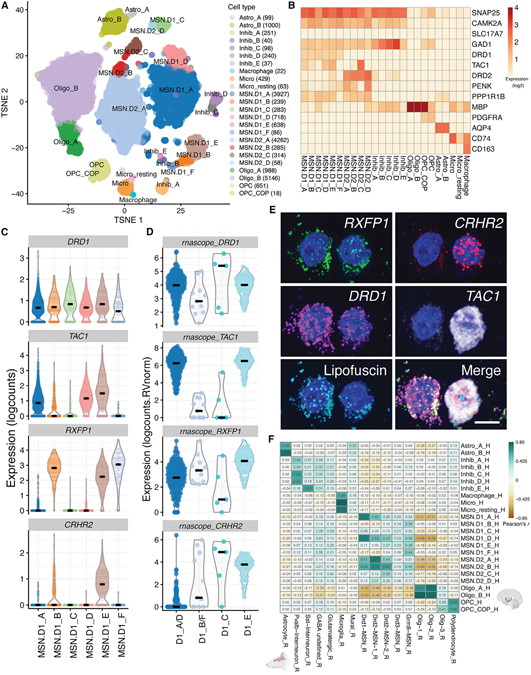
Figure 1. Distinct classes of D1- and D2-expressing MSNs in human NAc.
(A) t-distributed stochastic neighbor embedding (tSNE) plot of 19,789 nuclei (n = 8 donors) across 21 clusters, including 6 clusters of D1 MSNs and 4 clusters of D2 MSNs.
(B) Heatmap depicting log2 expression of canonical marker genes used to annotate each cluster.
(C) Violin plots for 4 genes differentially expressed (log2-normalized counts) in specific D1 classes (or class groups: CRHR2, DRD1, RXFP1, and TAC1) that were selected for validation using single-molecule fluorescence in situ hybridization (smFISH).
(D) Log2 expression of respective transcript counts per smFISH region of interest (ROI) (ROI size normalized) post lipofuscin masking (autofluorescence). Each DRD1+ ROI was classified into a Euclidean distance-predicted MSN class (or group of classes) and its/their respective expression.
(E) Multiplex smFISH in human NAc depicting a D1_C (left) and D1_E (right) MSN, side by side. Maximum intensity confocal projections showing the expression of DAPI (nuclei), CRHR2, DRD1, TAC1, and lipofuscin autofluorescence. Merged image without lipofuscin autofluorescence. Scale bar, 10 μm.
(F) Heatmap of Pearson correlation values evaluating the relationship between our human-derived NAc cell classes (rows) and reported rat NAc populations from Savell et al. (2020). Correlation was performed on the combined top 100 markers/cell populations in which annotated homology exists (here, 582 genes; see STAR Methods).

