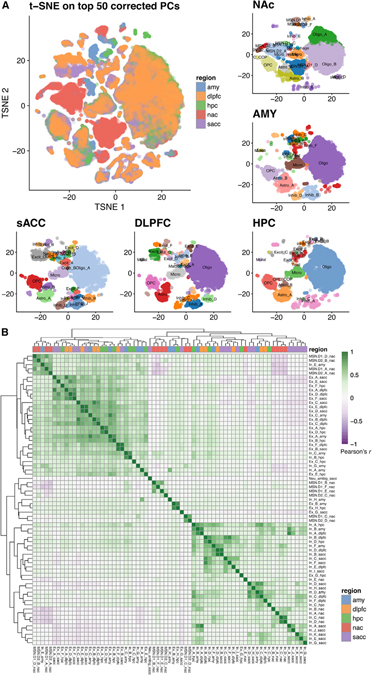
Figure 3. Across-regions analyses reveal whole-brain transcriptomic architecture and neuronal subtype similarities across regions.
(A) tSNE array of a total of 70,615 nuclei, paneled by each brain region and their regionally defined cell classes (a total of 107 cell classes).
(B) Pairwise correlation of t-statistics, comparing the top cell class marker genes of the 107 classes (total of 3,715 genes). Here, only the 69 neuronal classes are shown. Regions are colored and labeled in lowercase as the suffix (e.g., as “_hpc” for HPC); “Excit_” is abbreviated as “Ex_” and “Inhib_” as “In_.” Scale values are of Pearson correlation coefficient (r), which are printed in each cell in the version shown in Figure S11.

