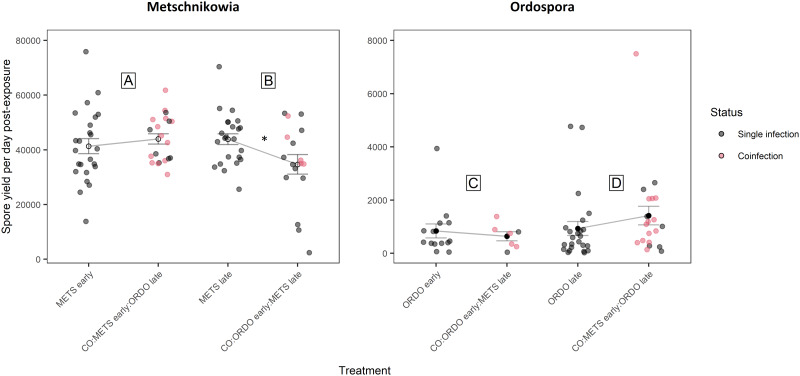
Fig. 4.
Graphical representation of parasite growth (computed as the ratio of spore yield upon host death and the number of days survived by the host, post-second exposure event) for the parasites Metschnikowia and Ordospora. Parasite growth was compared between single and co-exposure treatments, to answer the following: (A) How does Metschnikowia respond to later arrival of Ordospora? (B) How does Metschnikowia respond to prior infection by Ordospora? (C) How does Ordospora respond to later arrival of Metschnikowia? (D) How does Ordospora respond to prior infection by Metschnikowia? Coloured dots depict individuals which were confirmed to be coinfected by Metschnikowia and Ordospora. Error bars depict the standard error of the mean, which was computed by pooling singly and coinfected individuals in the co-exposure treatments. Significance levels are provided by analysis of variance (F-test) across single and co-exposure treatments with shared timing of infection: *P ⩽ 0.05.

