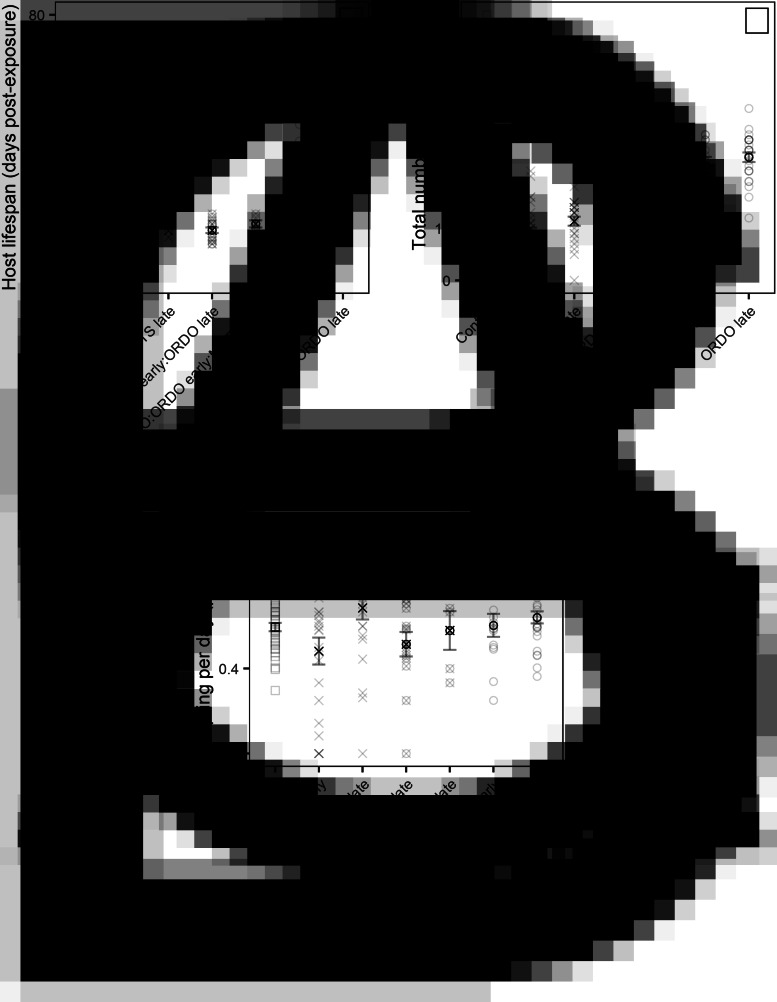
Fig. 6.
Graphical representation of (A) lifespan post-exposure, (B) total offspring production and the resulting (C) rate of offspring production (number of offspring per day post-exposure) compared for individual Daphnia across the control and all six exposure treatments. Only individuals successfully infected by one (single exposure) or both parasites (co-exposure) were included in the non-control treatments. Error bars depict the standard error of the mean.

