
FIGURE 3.
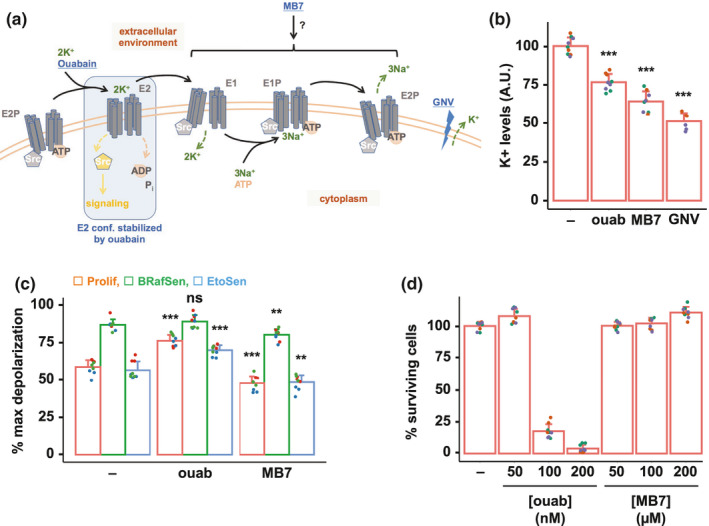
Senolysis by ouabain is not mediated by inhibition of ion transport. (a) Diagram of the Na,K‐ATPase's (NKA) Albers‐Post cycle. The various conformations adopted by the pump are indicated in gray. Compounds used in the study are in blue and underlined. In basal conditions, NKA binds Src and keeps it inactive. The NKA‐Src interaction is relieved when the pump adopts the E2 conformation, bound and stabilized by ouabain. GNV: gramicidin + nigericin + valinomycin. GNV is a combination of ionophores creating pores in the plasma membrane, resulting in an increased efflux of potassium from the intracellular to the extracellular medium. (b) Relative intracellular K+ levels of BRafSen cells after a 7‐h incubation with vehicle, 200 nM ouabain, or 200 µM MB7. GNV: positive control, treatment for 30 min with GNV 10 µM each. Following treatment with the compounds, cells were incubated with ION Potassium Green‐2 AM, a fluorescent potassium indicator. Fluorescence of live cells was measured in whole wells. The fluorescence of the indicator is proportional to intracellular K+ levels. Data were aggregated from three independent biological replicates. (c) Relative plasma membrane depolarization measurement in Prolif, BRafSen, and EtoSen cells after a 7‐h incubation with vehicle, 200 nM ouabain, or 200 µM MB7. Cells were incubated with 500 nM DiSBAC, whose fluorescence increases upon depolarization. Results were normalized to fluorescence intensity of cells in which maximum depolarization was achieved with 80 mM potassium gluconate. Data were aggregated from three independent biological replicates. (d) Dose–response toxicity assay of MB7 and ouabain in BRafSen cells. Cells were treated with increasing concentrations of MB7 and ouabain for 72 h. Note that 200 µM MB7 was not toxic in BRafSen cells despite inducing a similar K+ depletion as 200 nM ouabain, which conversely killed virtually all cells in 72 h. Data were aggregated from three independent biological replicates. For all panels, colored overlapping dots represent independent replicates. Results from statistical tests performed as described in the Section 4 are indicated as follows: *p < 0.05; **p < 0.01; ***p < 0.001