
Figure 2. Probability of Survival Without Clinical Worsening After Treatment Introduction.
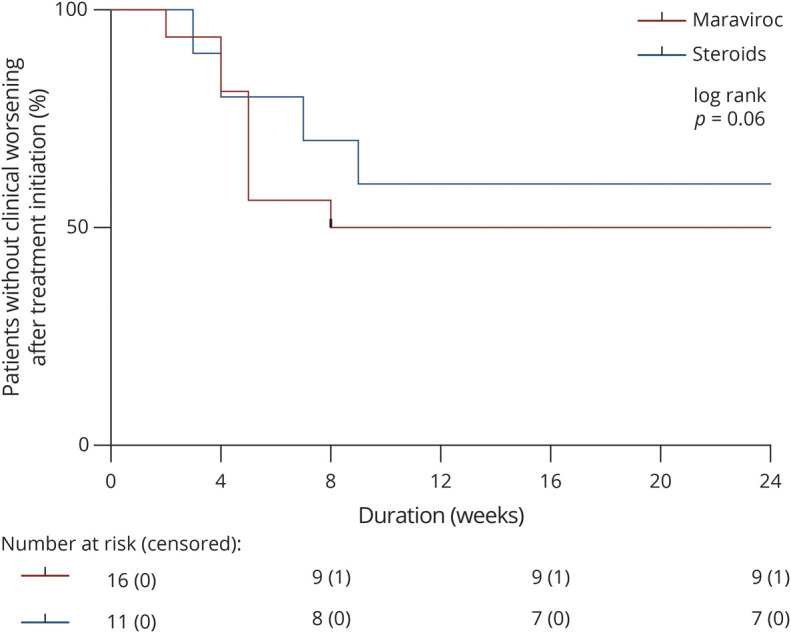
The graph depicts the proportion of patients free of clinical worsening following maraviroc (red line) or steroid (blue line) initiation. Ticks represent censored data. Above the graph are displayed the number at risk (and censored) in each group.