
Fig. 1.
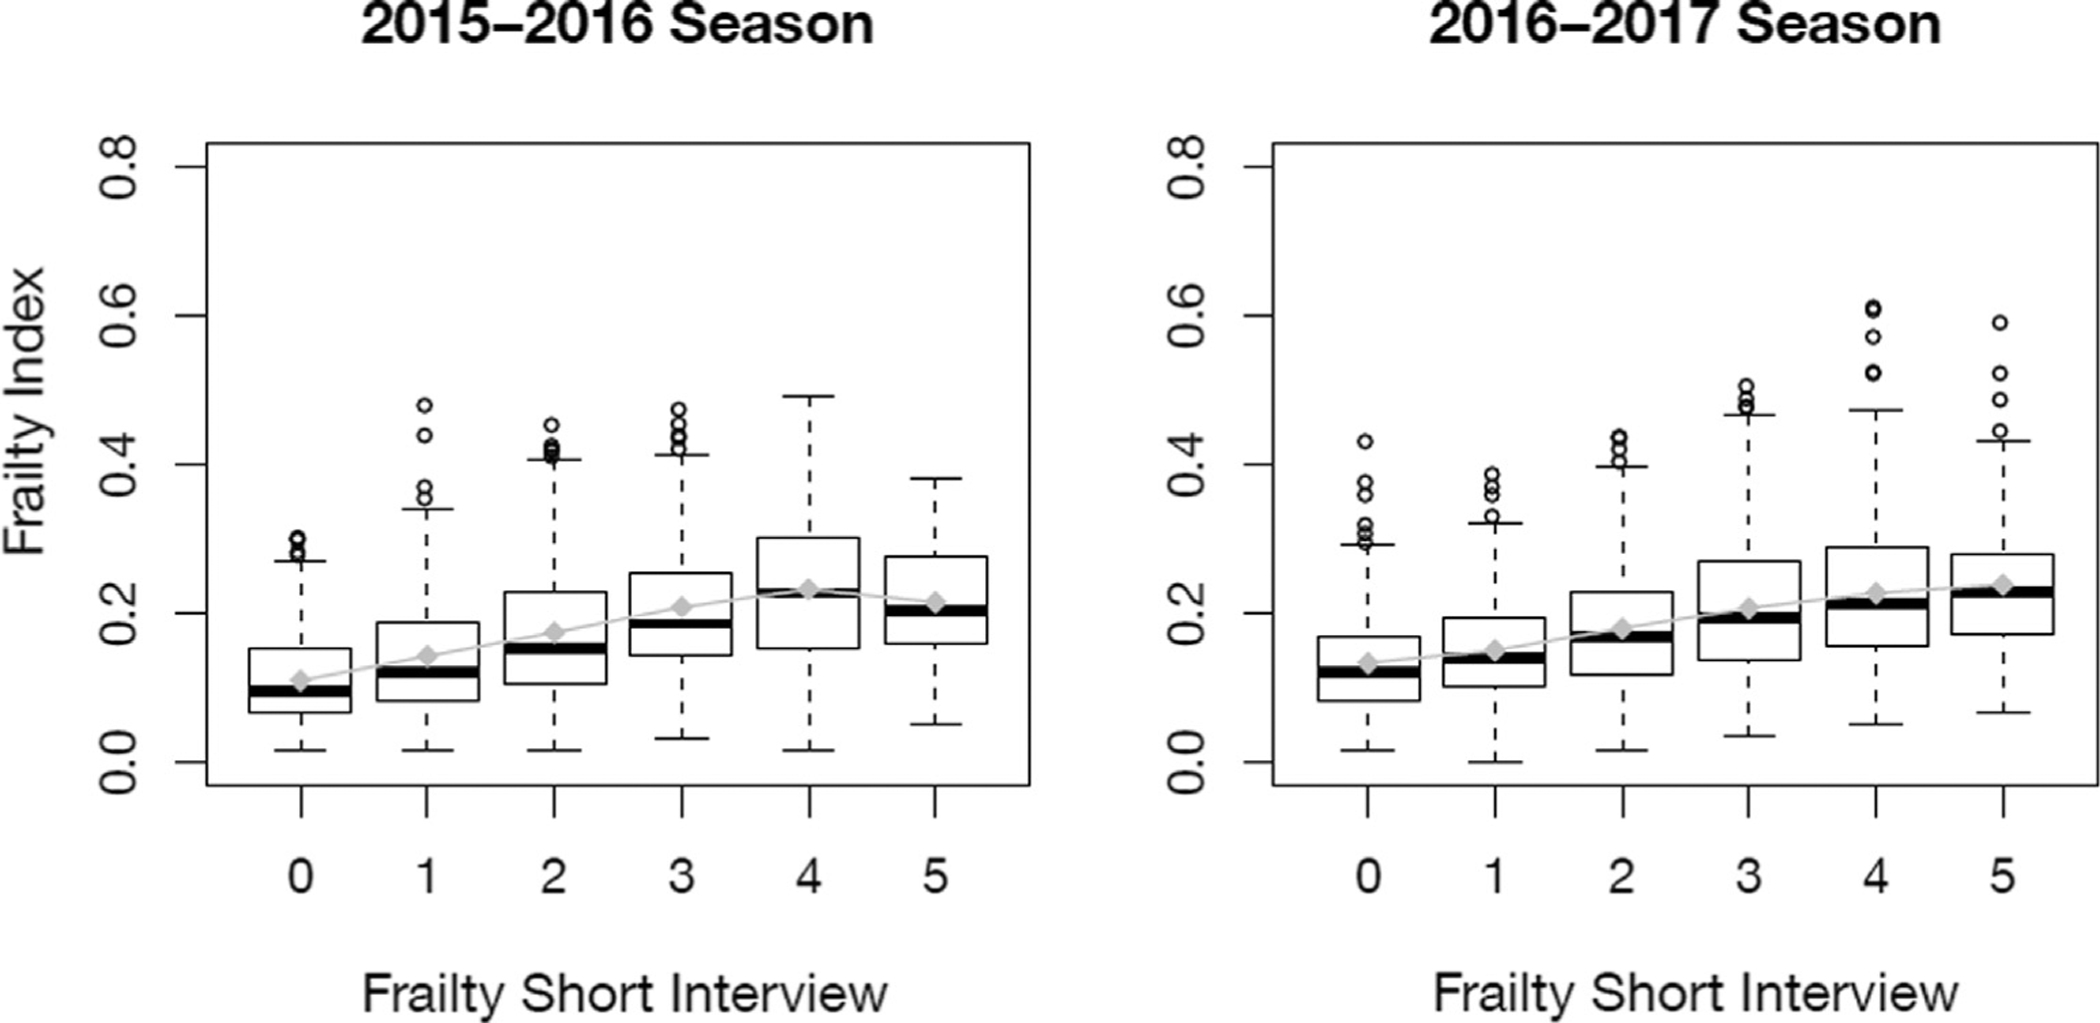
Association between frailty short interview and frailty index by study year. Boxes represent the interquartile range of the frailty index at each level of frailty short interview score with the median indicated by the thick black bar. Connected gray diamonds represent the mean frailty index at each level of frailty short interview score.