
Fig. 2.
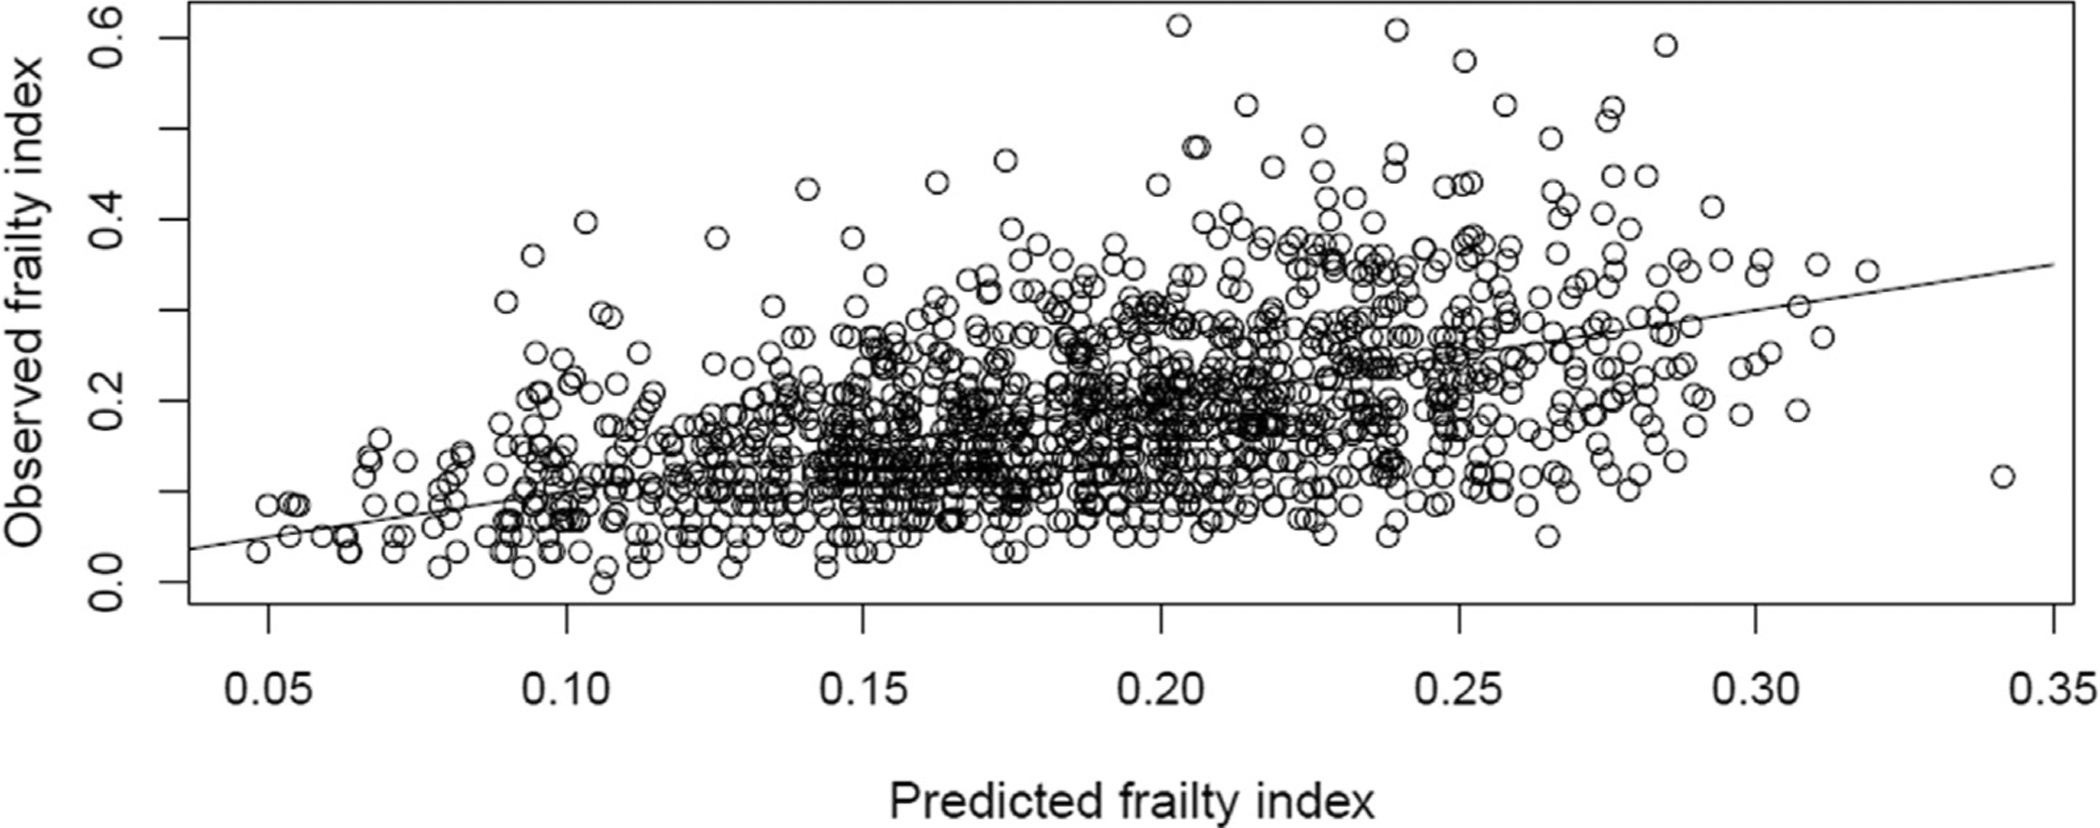
Scatter plot of observed frailty index scores vs those predicted in multivariable linear regression models including frailty short interview score, age at enrollment, gender, race, ethnicity, supplemental oxygen use at home, smoking status and study hospital.